ProxyTool Documentation
Complete reference for configuring proxies, chains, routing rules, DNS settings, and monitoring. Everything you need to get the most out of ProxyTool.
Core Features
Universal Proxy Routing
Route any application through your proxy — even apps without native proxy support. System-level traffic interception via WFP driver.
Split Tunneling & Per-App Rules
Define per-app routing rules. Proxy some apps, let others go direct, or block entirely — with priority ordering.
Proxy Chains
Chain multiple proxies: sequential multi-hop, redundancy failover, or load-balanced rotation.
Real-Time Traffic Monitor
Live connection table, bandwidth analytics, security events, TLS fingerprint detection, and cost tracking.
DNS & IP Protection
Full DNS leak prevention, remote resolution through proxy, UDP/IPv6 kill switch, and SMHNR blocking.
Profiles & Proxifier Migration
Portable config profiles, remote auto-update, encrypted passwords, and one-click Proxifier import.
Web Dashboard
Manage fleet devices, deploy policies, set restrictions, and control user permissions from the admin portal.
Policy & Restriction Management
Push proxy configs to device groups, lock down client UI, and enforce permissions remotely.
Getting Started
ProxyTool is a Windows desktop application that routes your internet traffic through proxy servers at the kernel level. It intercepts connections using a WFP (Windows Filtering Platform) driver, giving you full control over which applications use which proxy — without modifying individual app settings.
Quick Setup (3 Steps)
- Add a proxy — Enter your proxy server details (host, port, protocol) or paste a proxy string
- Create a routing rule — Choose which applications or traffic should use the proxy
- Activate — Traffic is immediately routed through the proxy
Account & Sign-In
ProxyTool uses a unified account for the web dashboard and desktop client. Sign in at /auth/login with email and password. If two-factor authentication is enabled, complete the TOTP or email OTP step before access is granted.
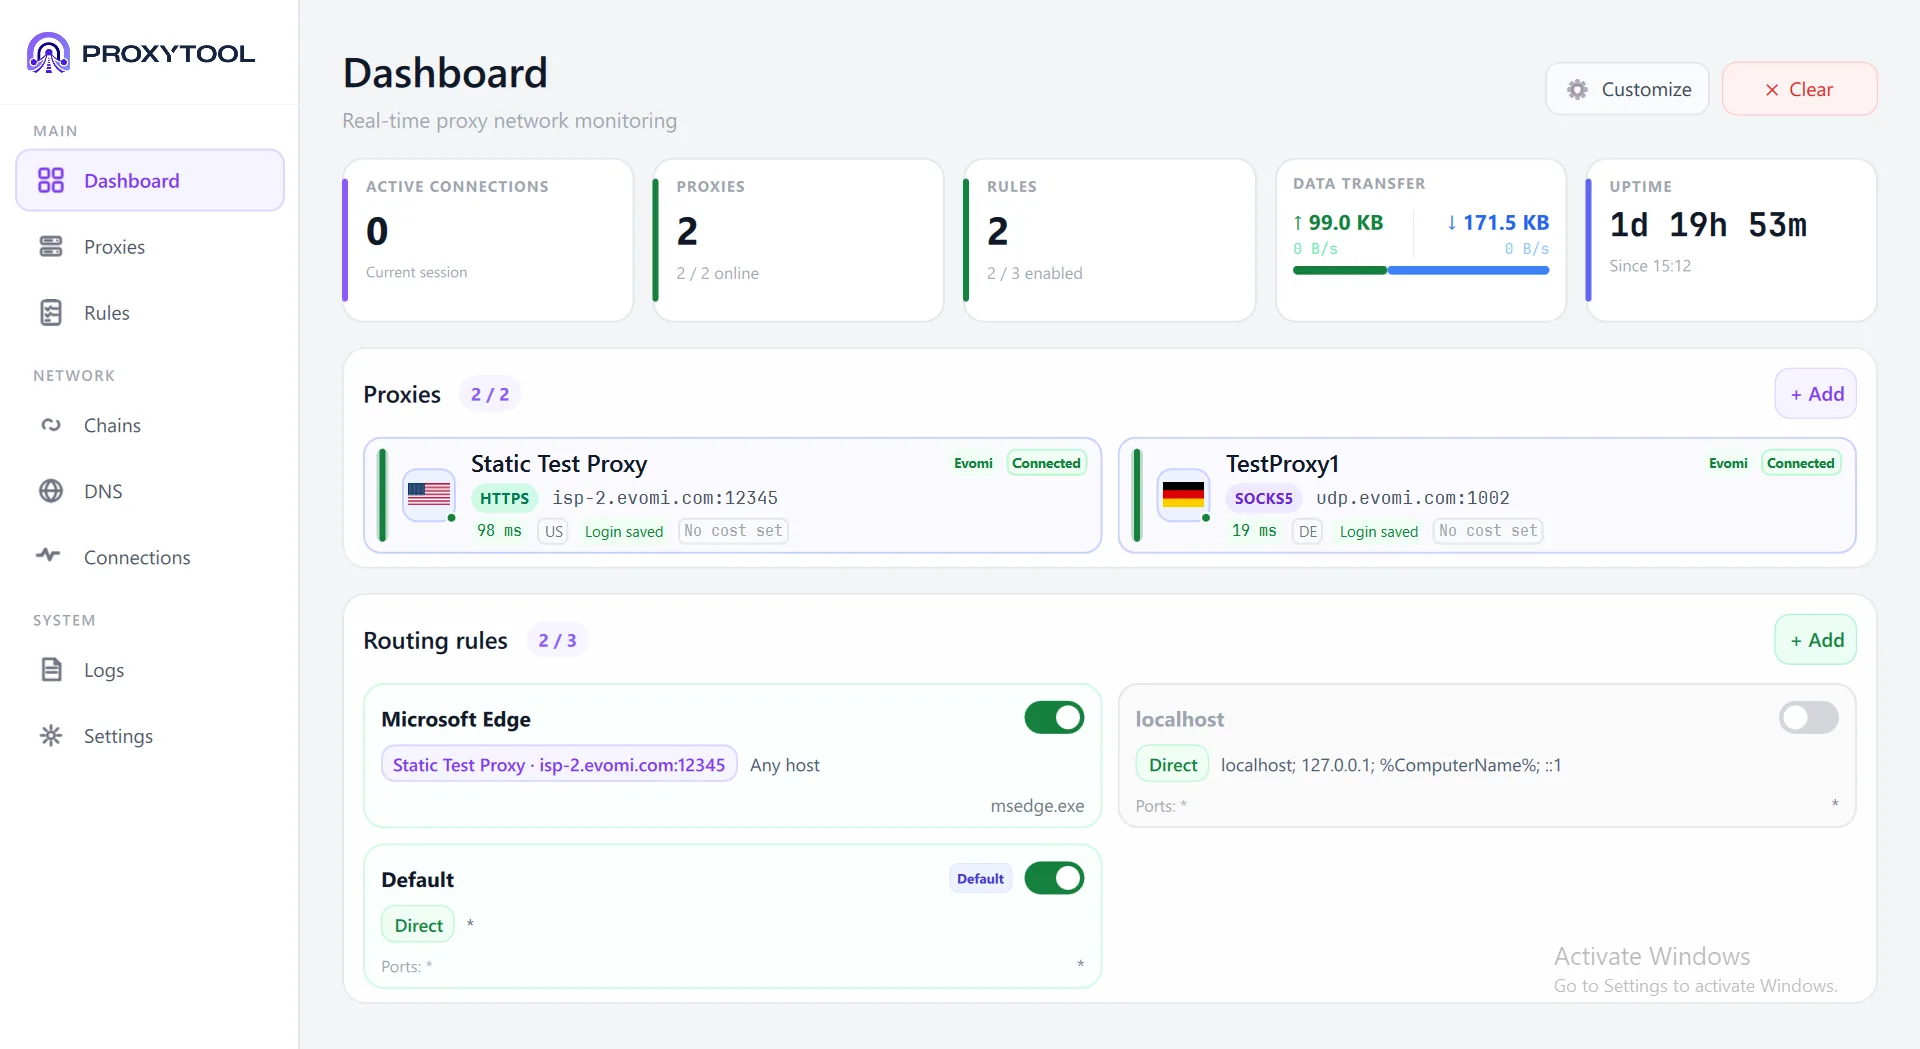
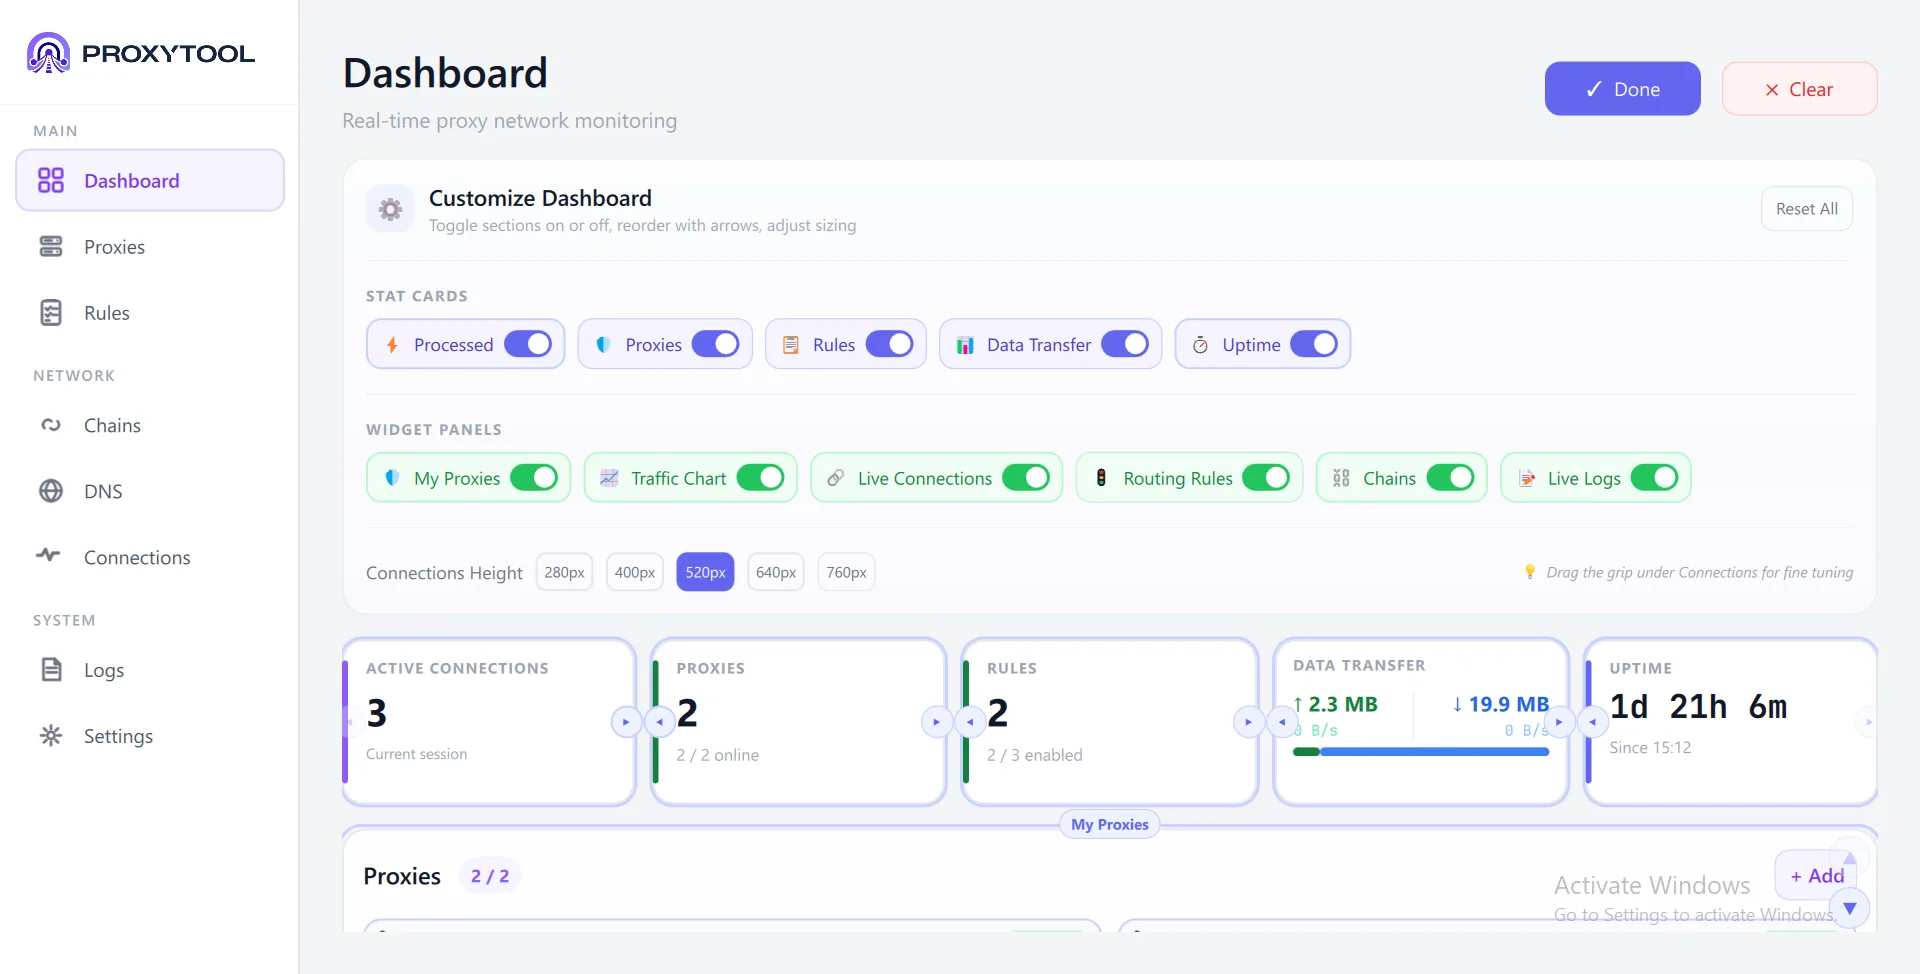
Dashboard at a Glance
The Dashboard is your central hub — it shows everything happening on your network in real time. Here's what each section does:
Customize Your Dashboard
Click Customize in the top-right corner to enter edit mode. A toolbar appears at the top of the dashboard where you can control every section individually.
Stat Cards
Toggle each metric card on or off — disabled cards are hidden from the dashboard entirely.
| Card | Shows |
|---|---|
| Processed | Total connections handled in the current session |
| Proxies | Online proxies vs. total configured (e.g. 2 / 2 online) |
| Rules | Enabled routing rules vs. total (e.g. 2 / 3 enabled) |
| Data Transfer | Total bytes sent and received with a progress bar |
| Uptime | Time since ProxyTool was started (e.g. 1d 21h 6m) |
Widget Panels
Each widget panel represents a major dashboard section. Disable panels you don't need to keep things focused.
| Panel | Content |
|---|---|
| My Proxies | Quick overview of all configured proxy servers with status and latency |
| Traffic Chart | Real-time bandwidth graph with in/out/average throughput |
| Live Connections | Active connection table with process, target, proxy, and transfer data |
| Routing Rules | Rule cards with on/off toggles and assigned proxy details |
| Chains | Proxy chain configurations (Simple, Redundancy, Load Balancing) |
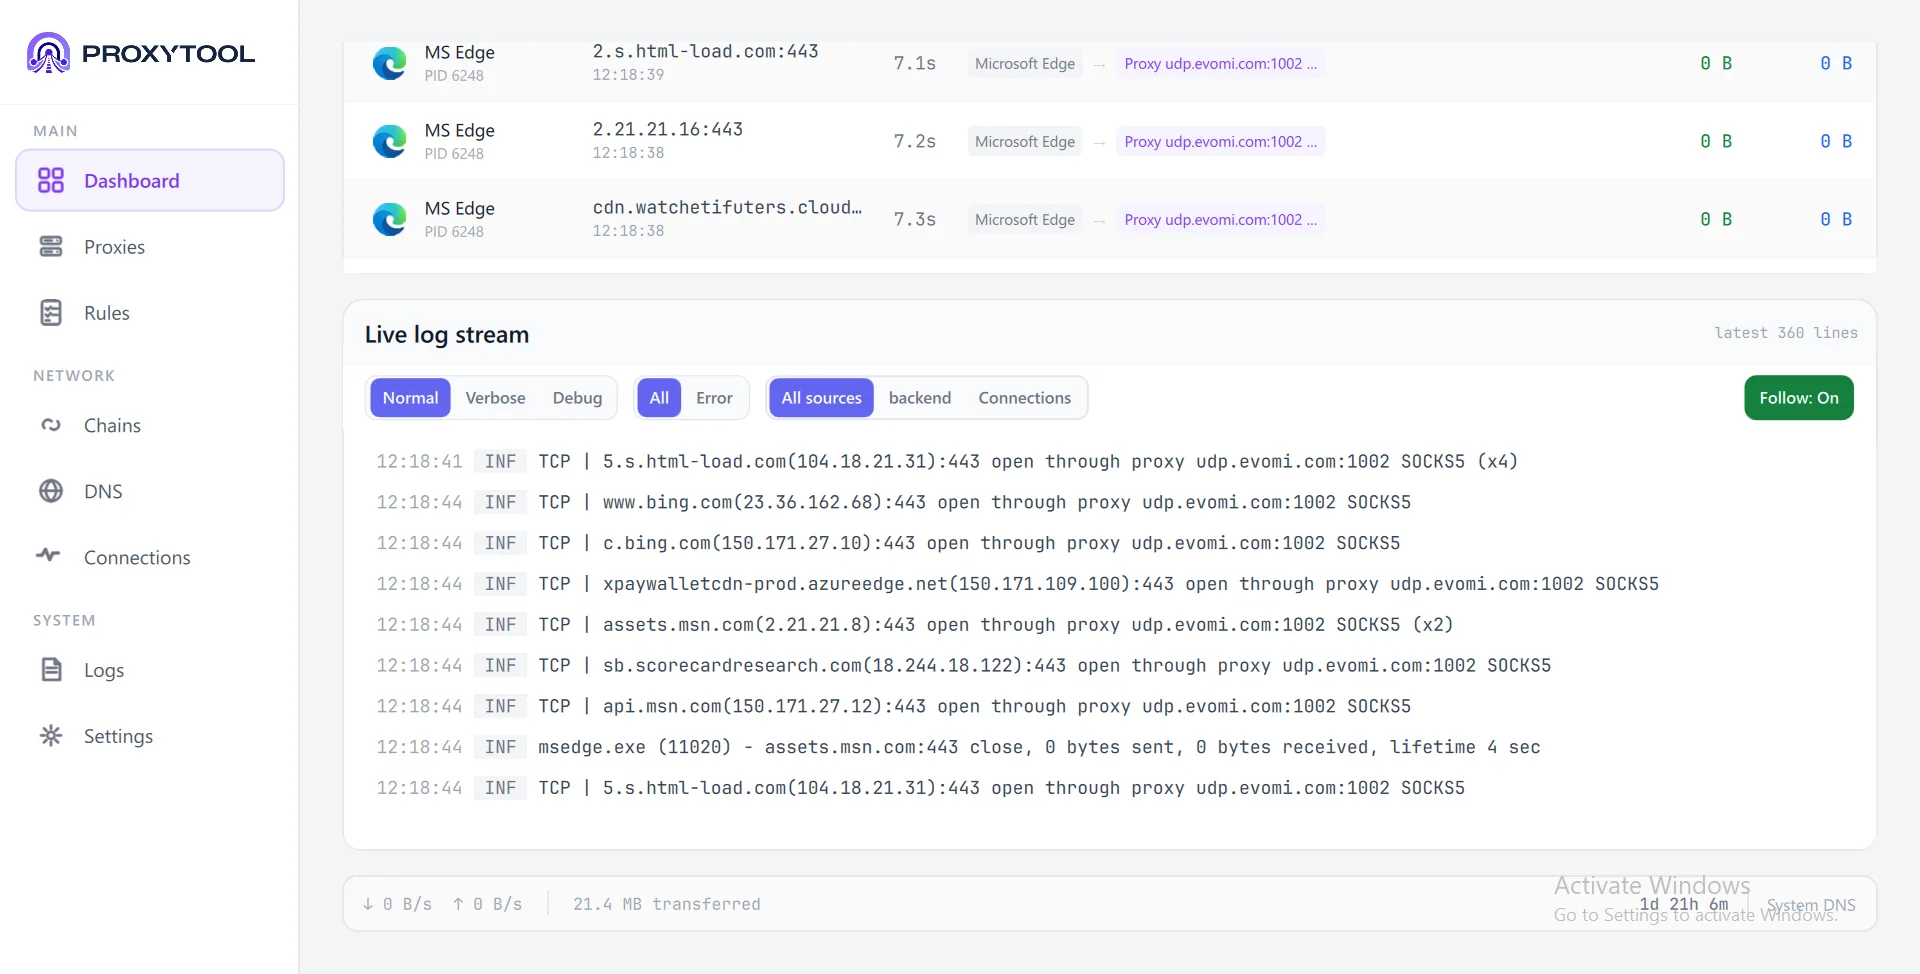
| Live Logs | Real-time event log with verbosity and source filters |
Layout Options
- Connections Height — Choose between 280px, 400px, 520px, 640px, or 760px to control how many connection rows are visible without scrolling
- Reorder — Drag the arrow handles between stat cards to rearrange their order
- Fine-tuning — Drag the grip under the Connections panel to adjust its height precisely
Click Done to save your layout. Use Reset All to restore the default arrangement, or Clear to remove all customizations and start fresh.
Adding a Proxy
Click Add Proxy on the Proxies page to open the configuration dialog. You can either fill in fields manually or paste a proxy string for instant setup.
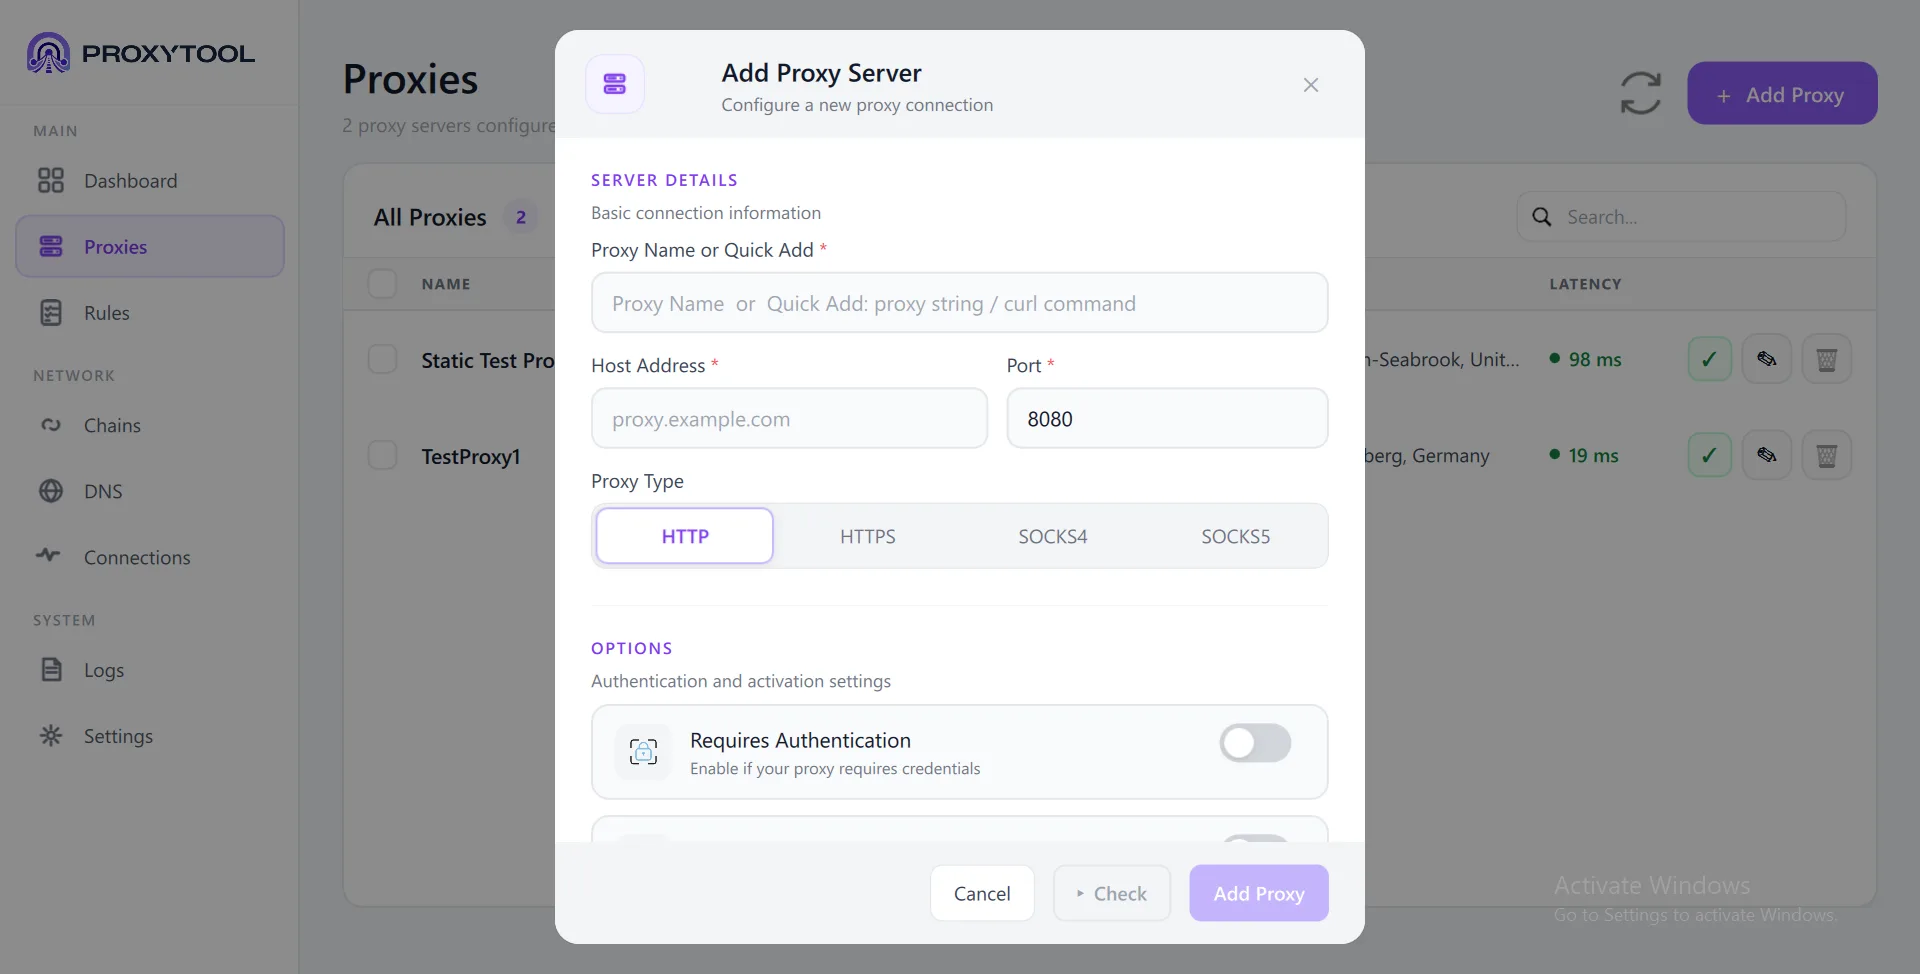
Server Details
These fields are identical for every proxy type. Enter address details manually or use Quick Add: paste a proxy string (e.g. socks5://host:port:user:pass) or a curl -x command and all fields auto-fill instantly.
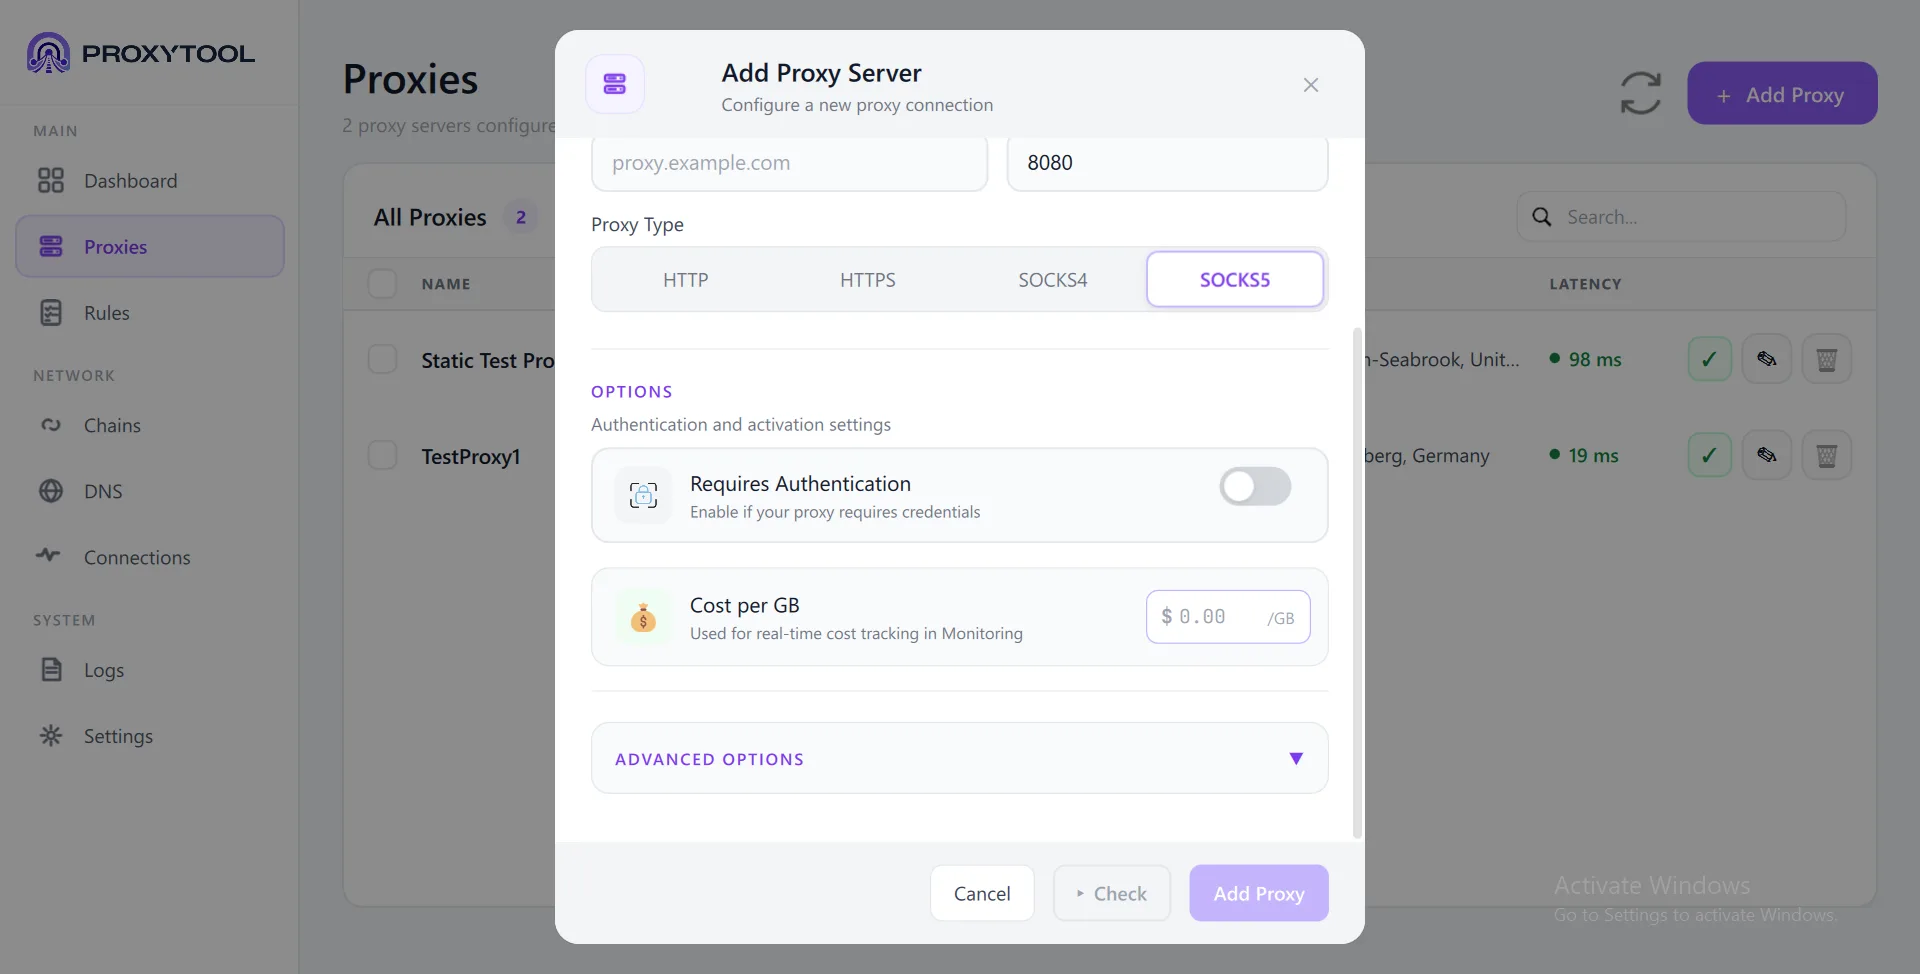
Options by Protocol
The options shown below the protocol selector differ depending on the type you choose. Use the carousel tabs above to compare each protocol side by side.
| Option | HTTP / HTTPS | SOCKS4 | SOCKS5 |
|---|---|---|---|
| Requires Authentication | Username + Password + Method selector (Basic / NTLM / Negotiate) | N/A — replaced by User Identification | Username + Password (auto-negotiated) |
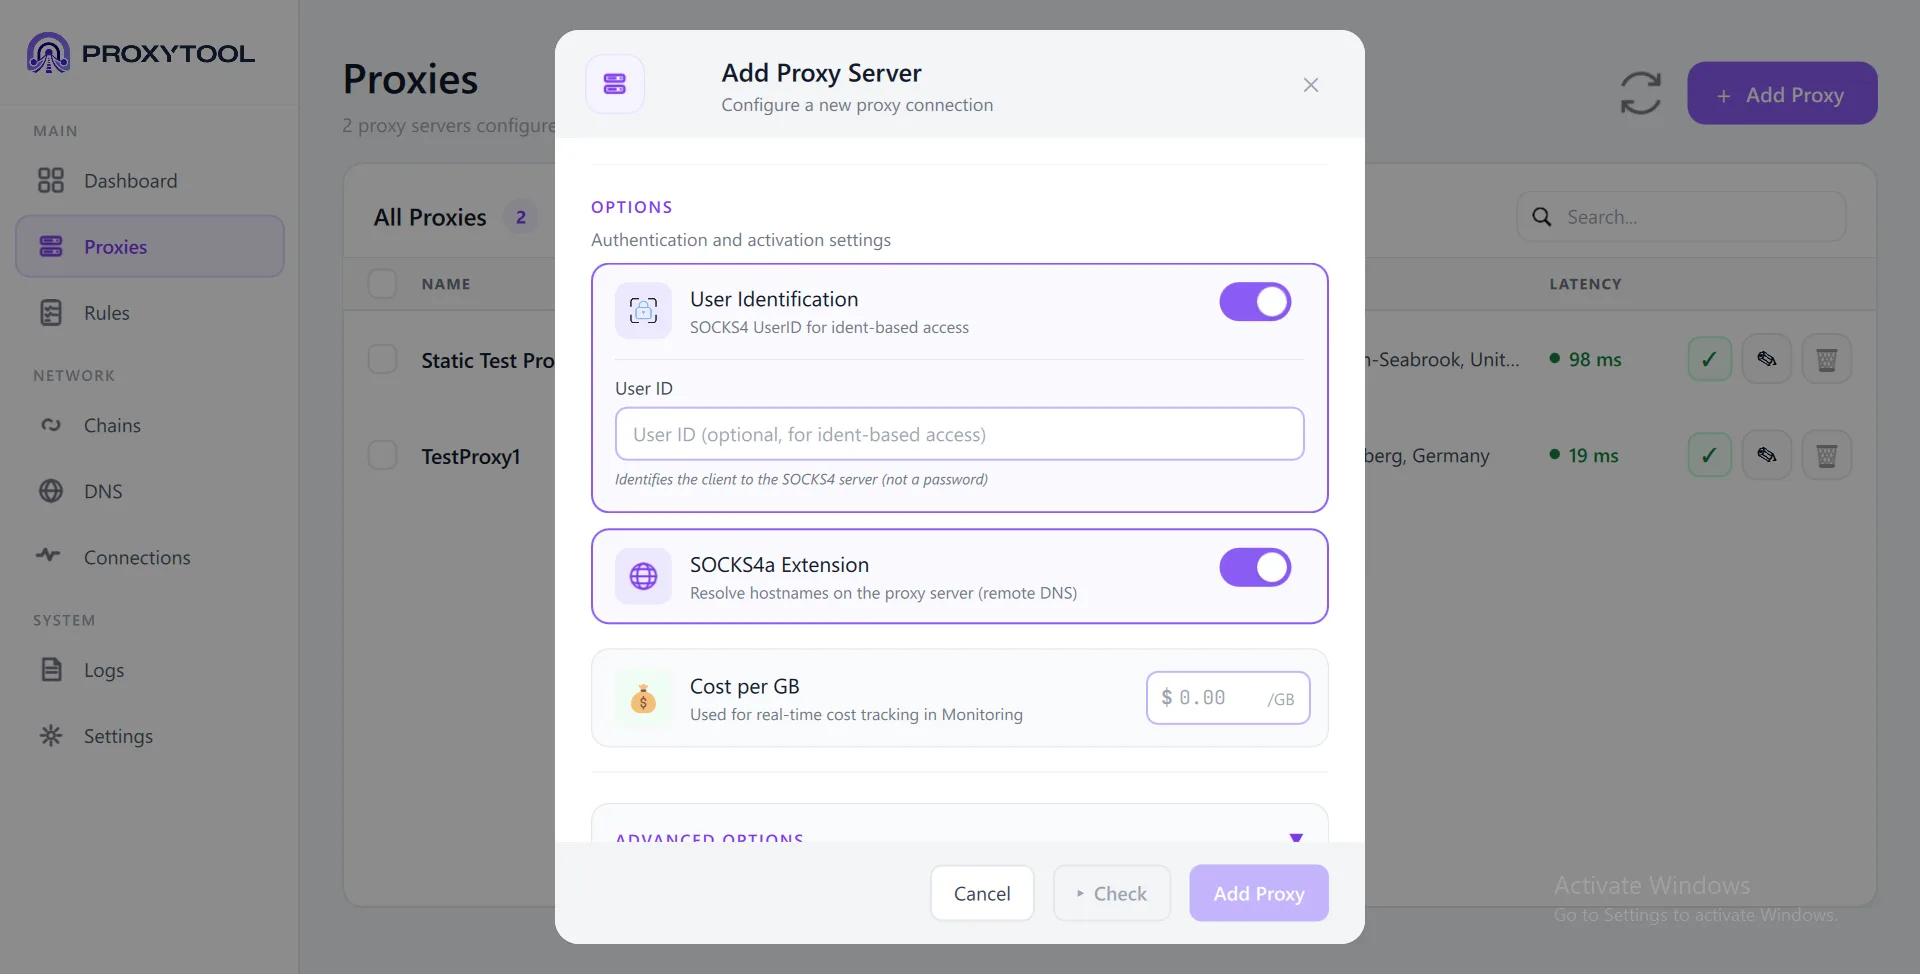
| User Identification | N/A | User ID string (ident-based access, no password) | N/A |
| SOCKS4a Extension | N/A | Toggle — enables remote DNS via proxy | N/A (remote DNS built-in) |
| Send User-Agent | Toggle — sends browser User-Agent header in CONNECT requests |
N/A | N/A |
| Cost per GB | Yes | Yes | Yes |
| Advanced Options | Yes | Yes | Yes |
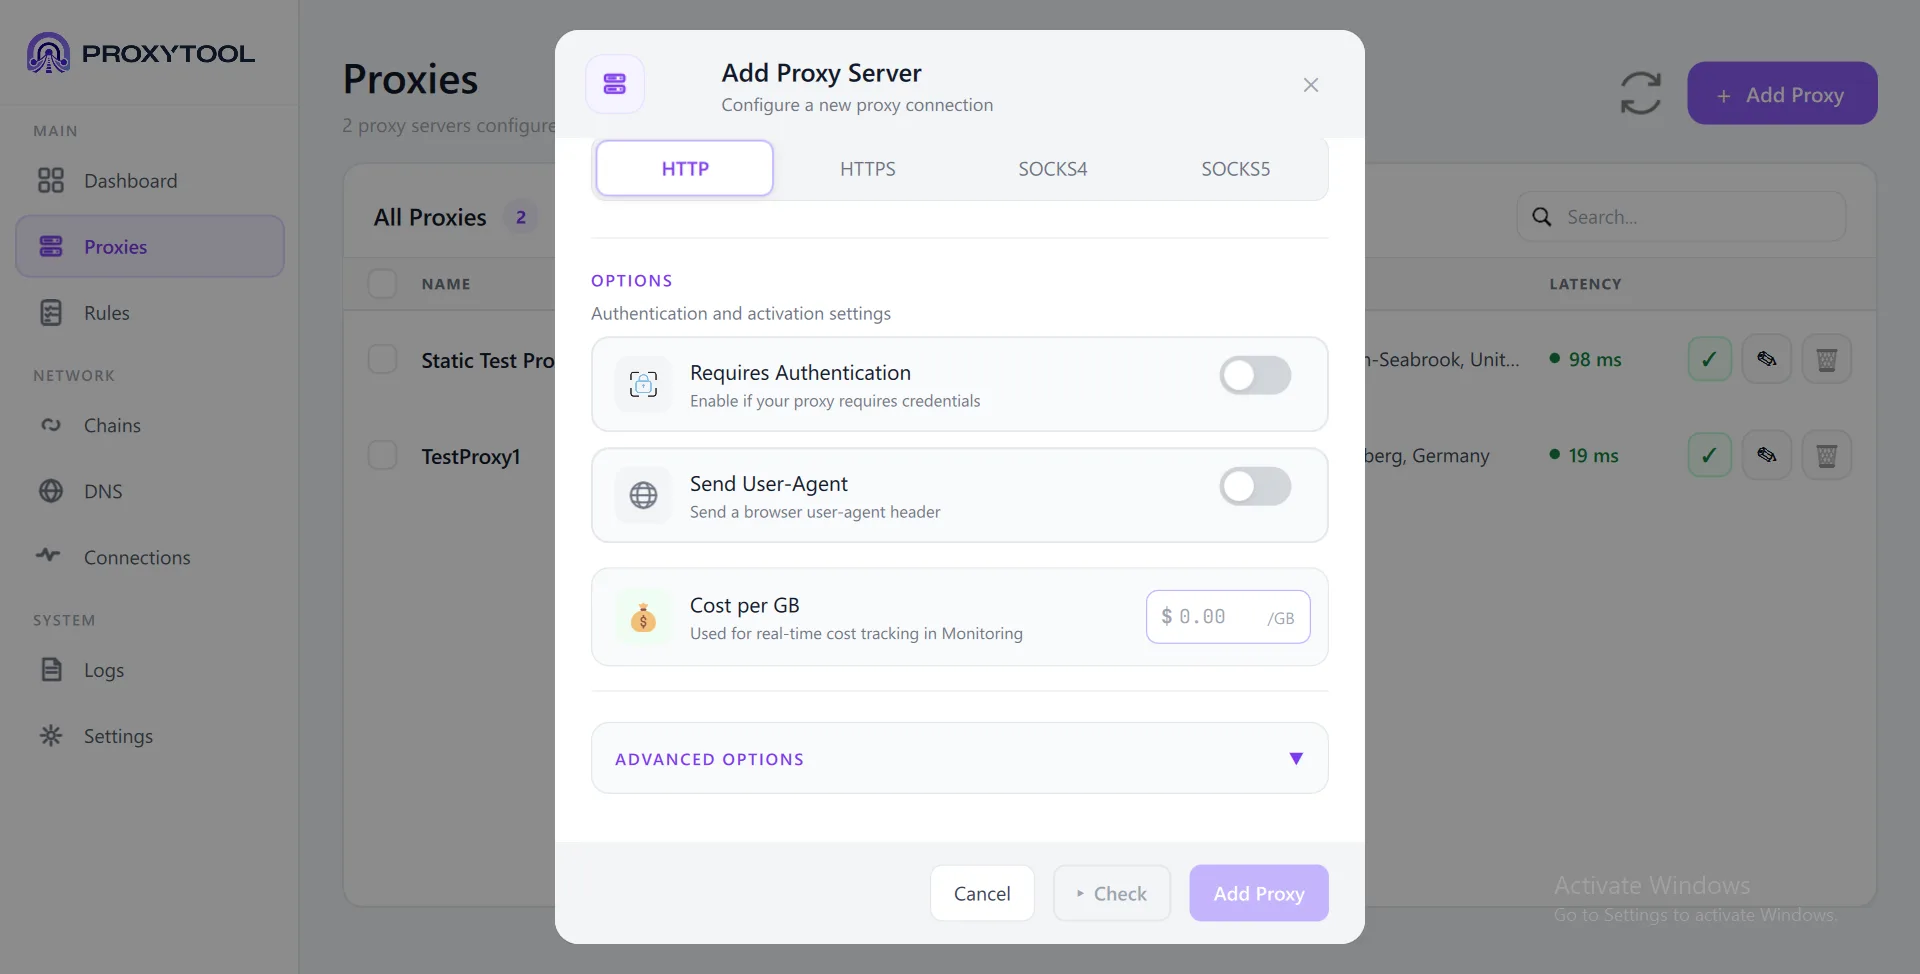
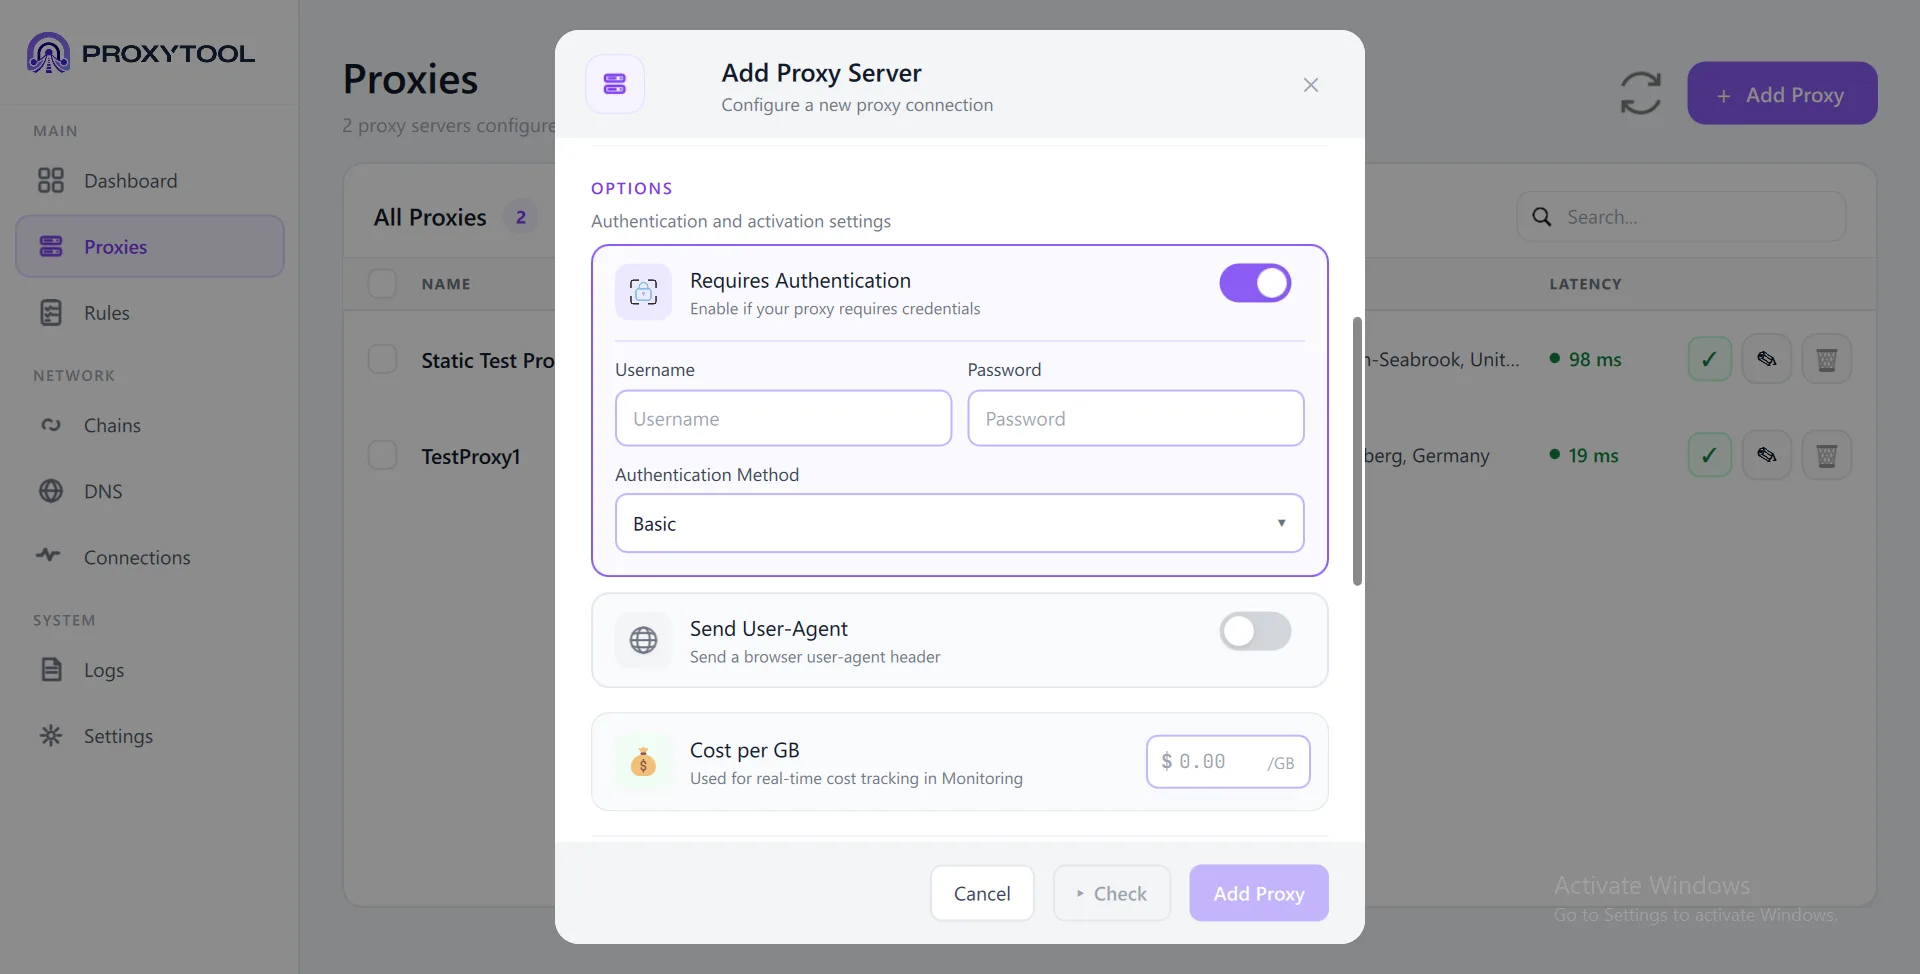
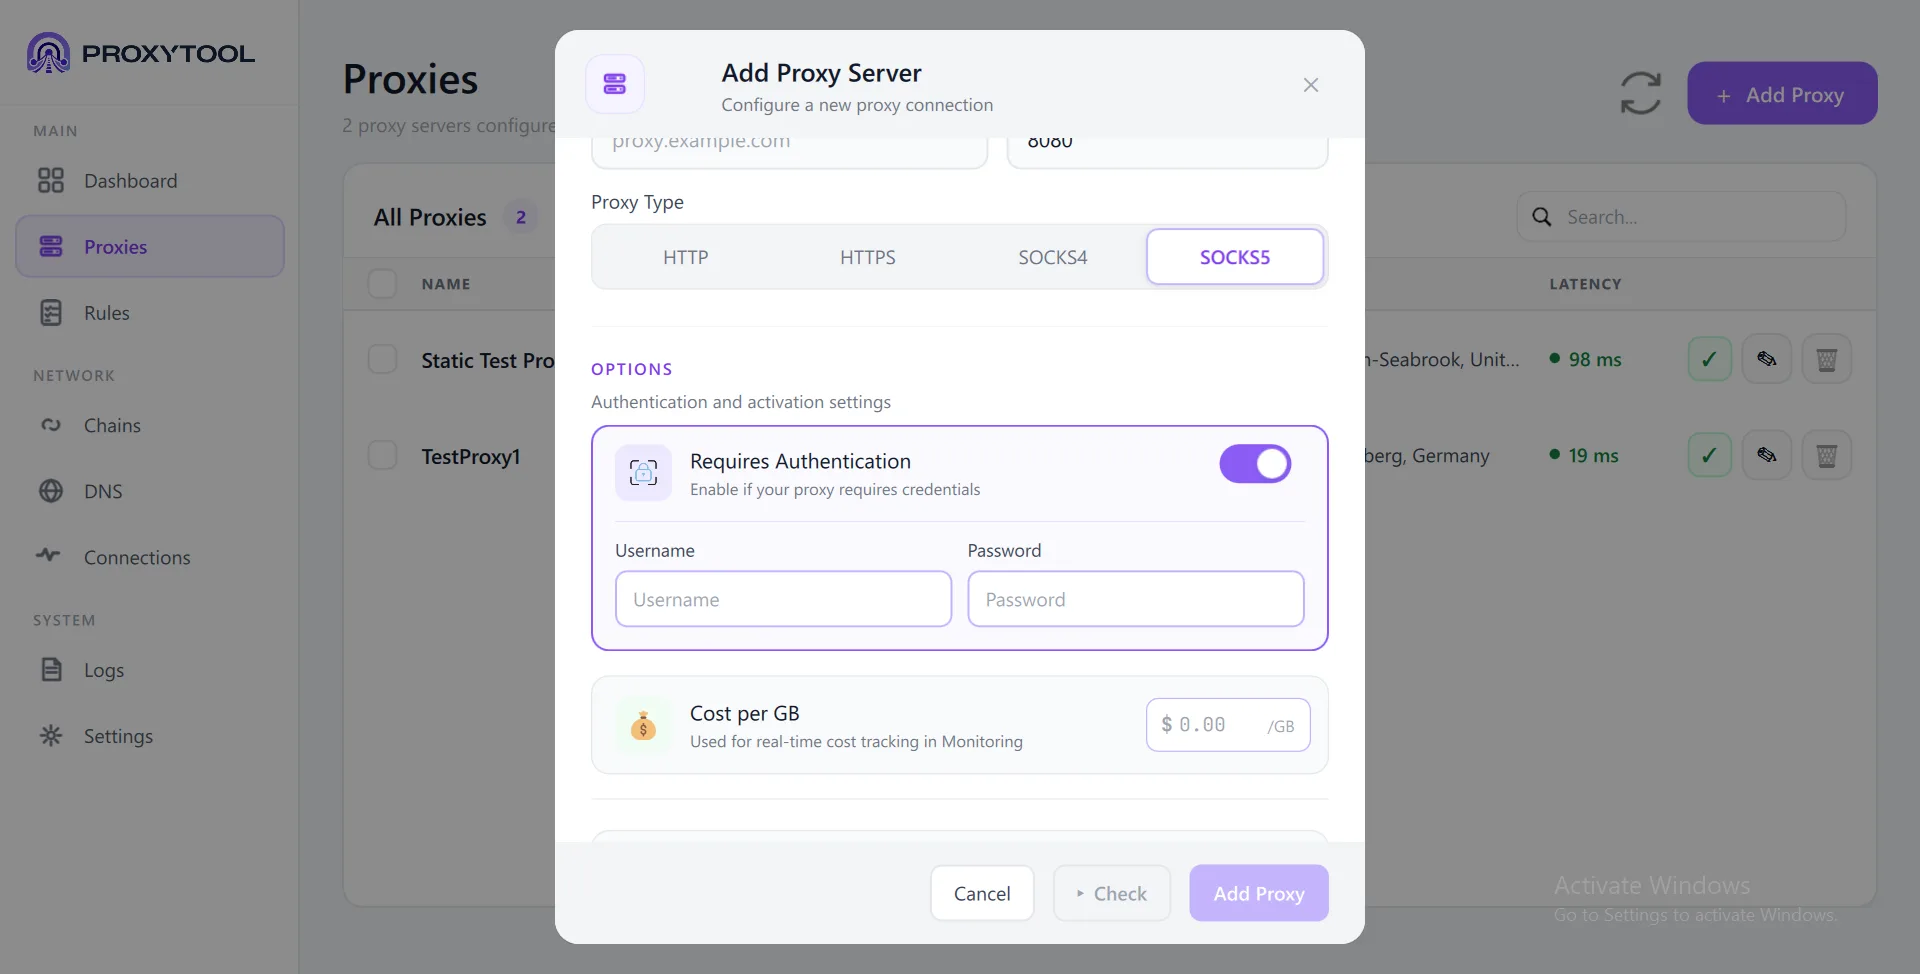
Authentication Details
Toggle Requires Authentication (or User Identification for SOCKS4) to reveal credential fields. The layout changes per protocol:
| Feature | HTTP / HTTPS | SOCKS4 | SOCKS5 |
|---|---|---|---|
| Credential fields | Username + Password | User ID only (no password) | Username + Password |
| Auth method | Basic, NTLM, or Negotiate (Kerberos) — dropdown selector | N/A — ident string sent with CONNECT | N/A — method auto-negotiated (RFC 1929) |
| Use Current User Login | Yes (NTLM/Negotiate — uses Windows SSPI credentials) | N/A | N/A |
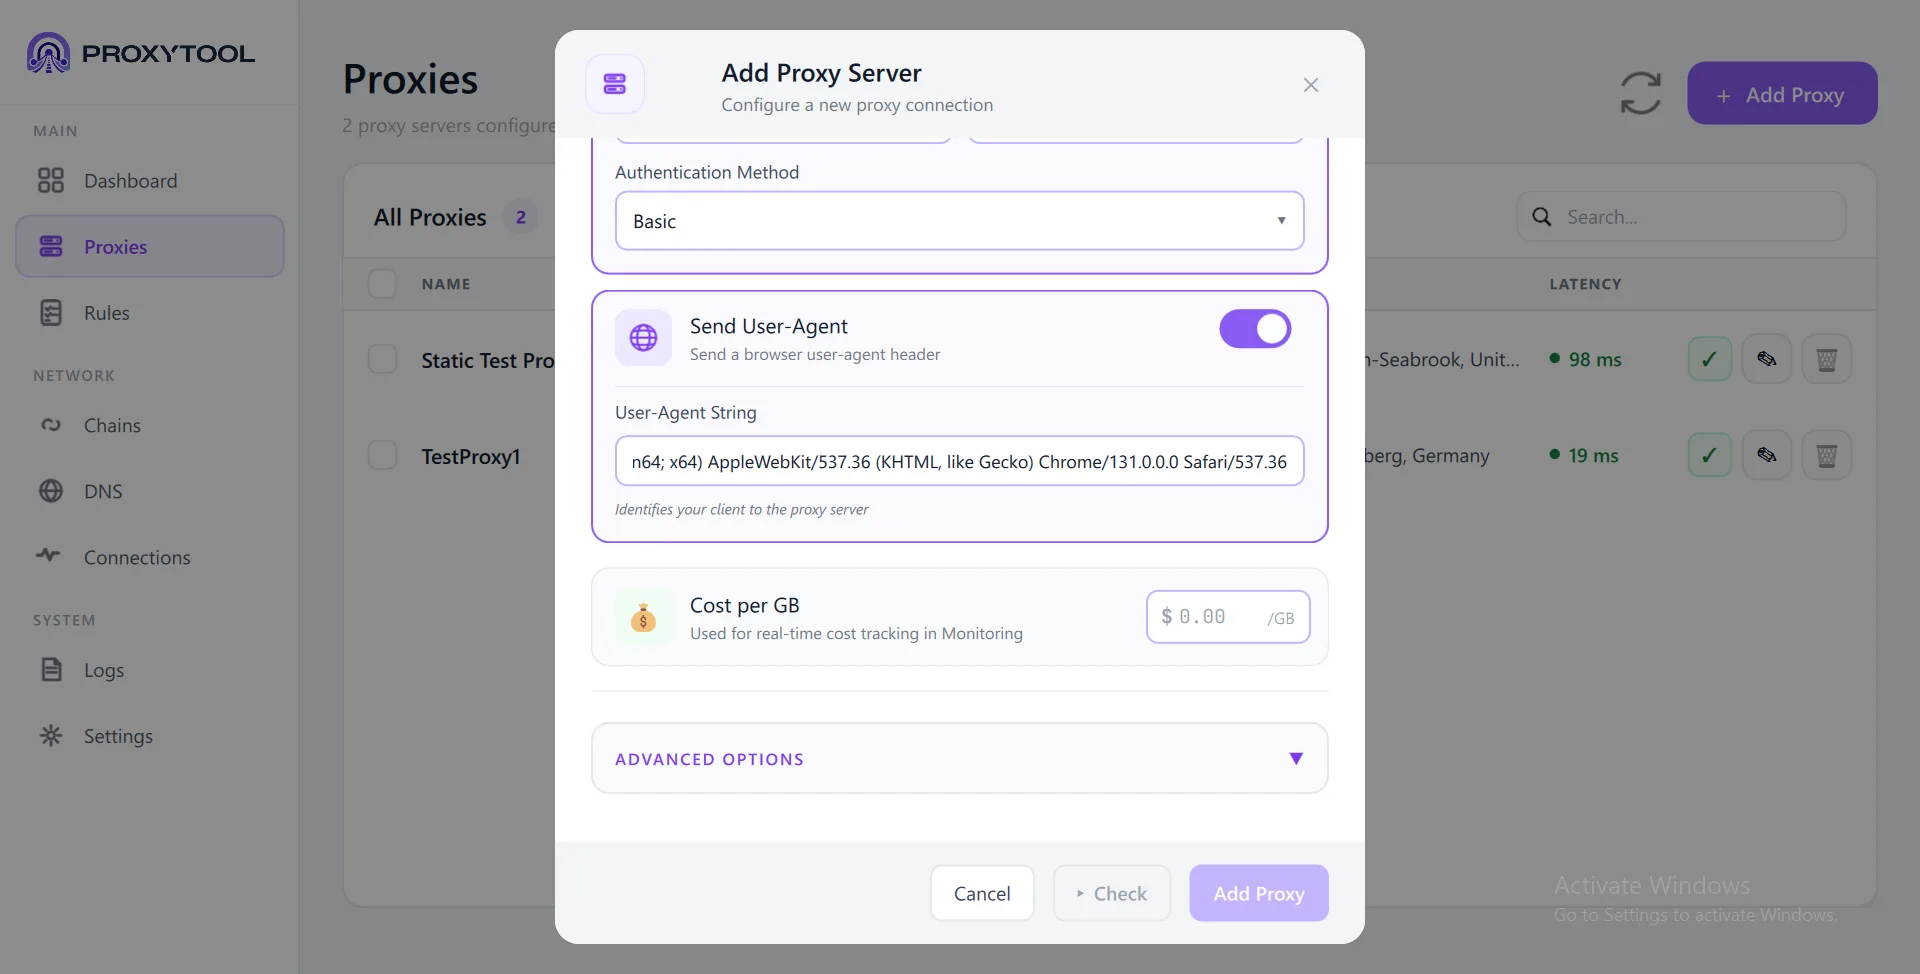
Send User-Agent (HTTP / HTTPS only)
When enabled, ProxyTool adds a User-Agent header to the HTTP CONNECT handshake. Some proxies require this to allow the connection. A default Chrome 131 string is pre-filled, but you can set any custom value. This option does not appear for SOCKS4 or SOCKS5 because these protocols do not use HTTP headers.
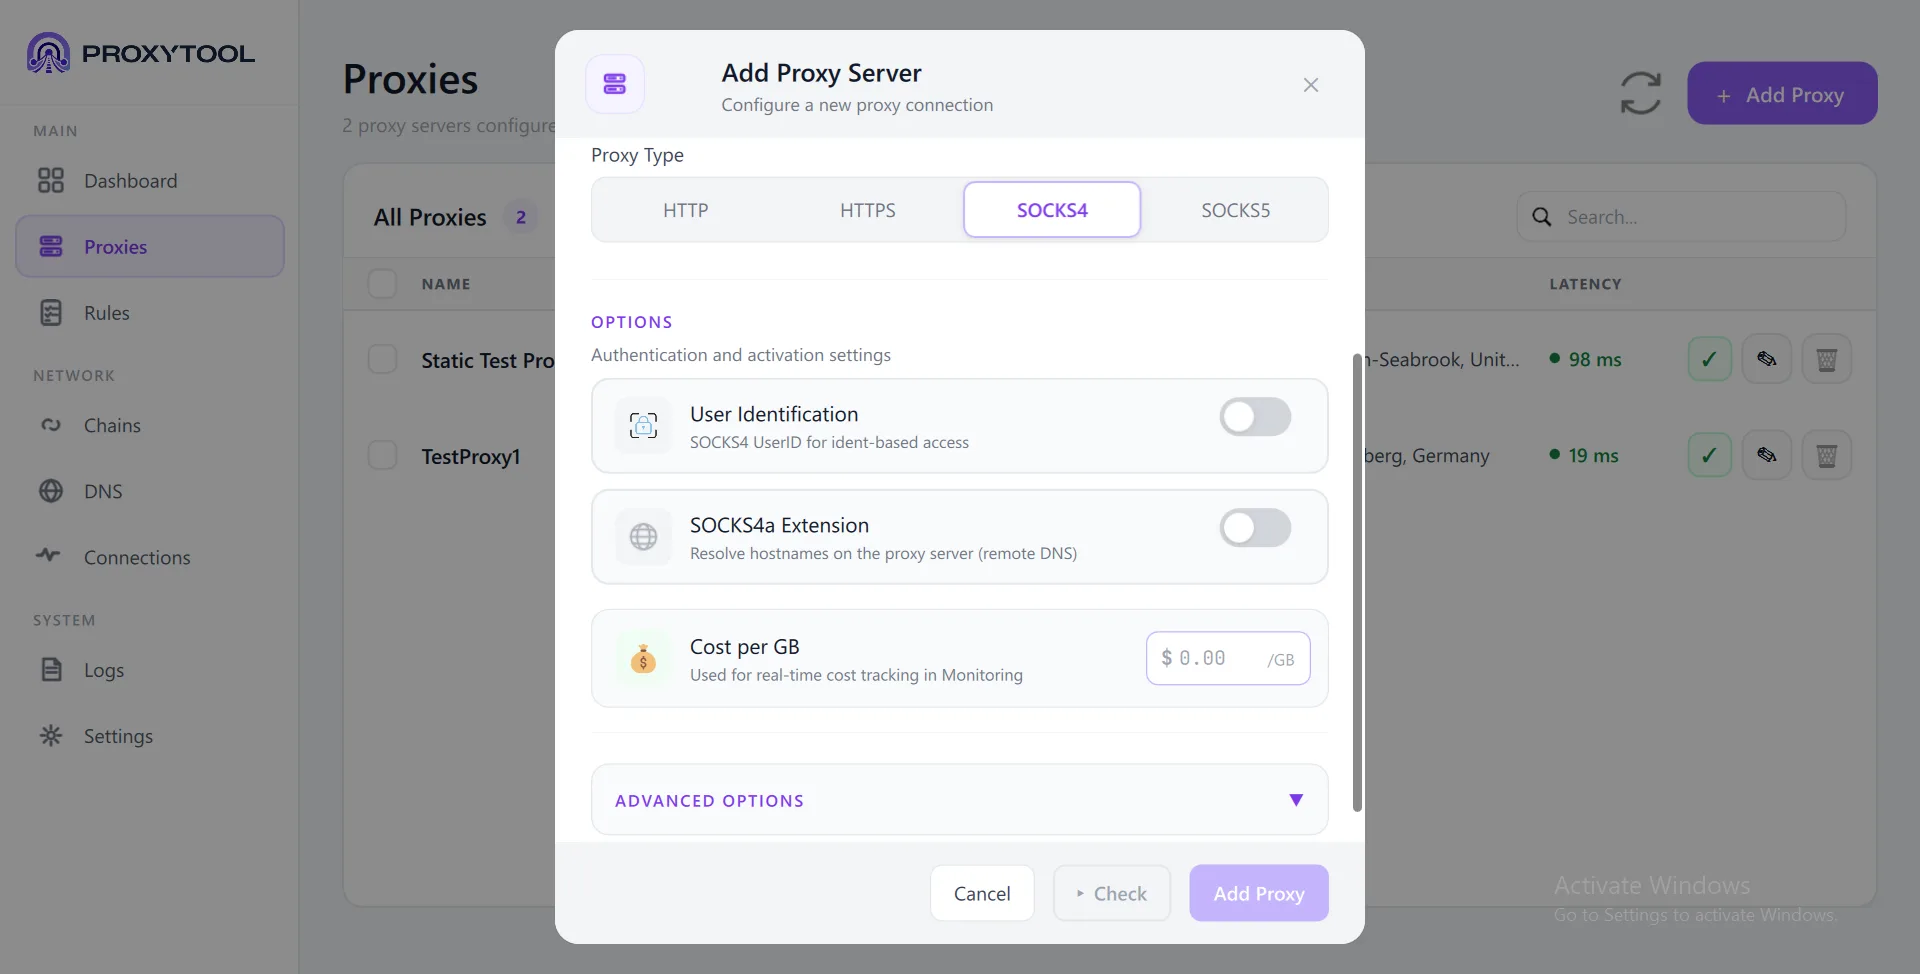
SOCKS4a Extension (SOCKS4 only)
Standard SOCKS4 resolves hostnames locally before forwarding — which leaks DNS queries. With SOCKS4a enabled, the hostname is sent to the proxy for remote resolution, keeping your DNS private.
ProxyTool sends a dummy IP (0.0.0.1) along with the target hostname. The proxy resolves the hostname on its end — your local DNS never sees the domain name.
| Mode | DNS Resolution | Privacy |
|---|---|---|
| SOCKS4 (off) | Client resolves locally to IPv4 | DNS visible to ISP |
| SOCKS4a (on) | Proxy resolves remotely | DNS hidden from ISP |
Cost per GB
Available for all protocol types. Enter your cost rate (e.g. $2.50 /GB) to enable real-time cost tracking in the Connection Monitor — especially useful for residential or metered proxies.
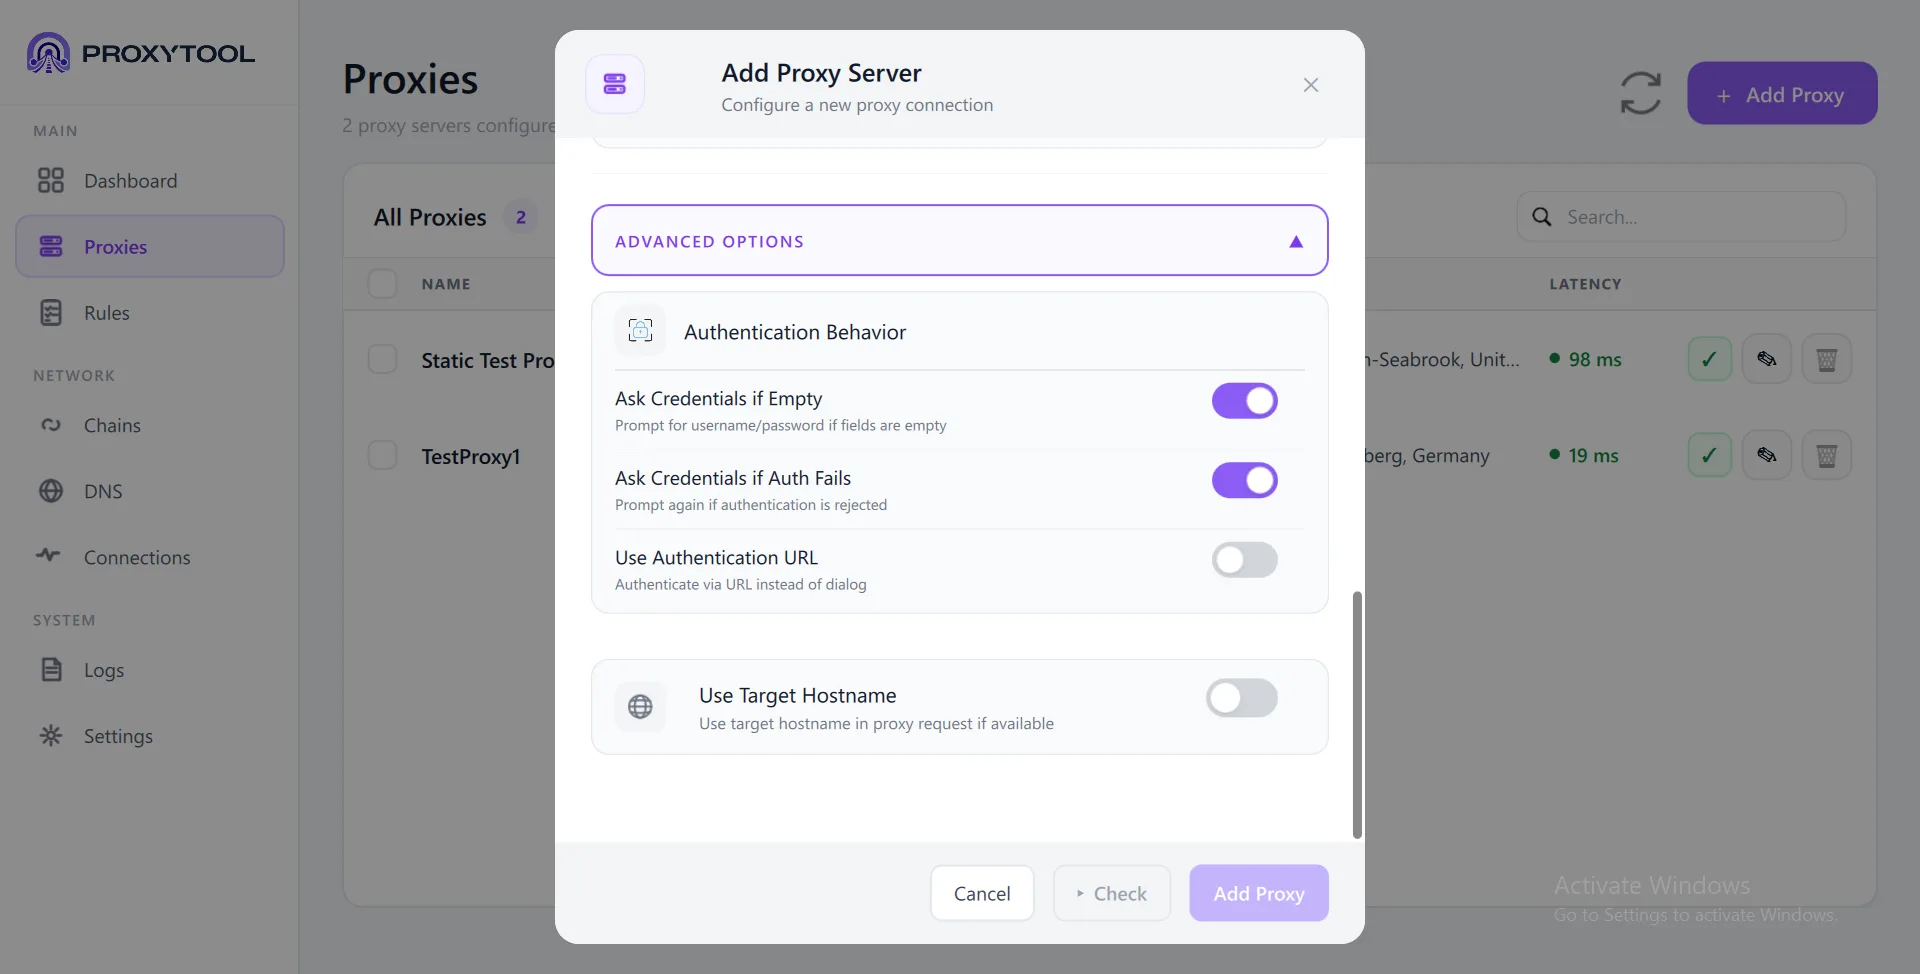
Advanced Proxy Settings
Expand the Advanced Options section in the Add Proxy dialog to access these settings. They apply to all proxy types unless noted.
| Option | Default | What it does |
|---|---|---|
| Ask Credentials if Empty | On | Shows an interactive login prompt at connect time if no credentials are saved for this proxy |
| Ask Credentials if Auth Fails | On | Re-prompts for credentials when the proxy rejects authentication (HTTP 407, SOCKS rejection) |
| Use Authentication URL | Off | Authenticate via a URL instead of stored credentials. Used for enterprise proxies (e.g. Blue Coat) that use web-based auth portals |
| Authentication URL | — | The URL to use for authentication. Supports embedded credentials: scheme://user:pass@host. Required when the toggle is enabled |
| Use Target Hostname | Off | Sends the original hostname (not resolved IP) in the proxy CONNECT request. Useful when the proxy needs to see domain names for routing or logging |
Inline Proxy Checker
Before saving, click Check to verify connectivity. The checker runs a multi-step test against a configurable target (default: google.com):
- Proxy connection — TCP connect to the proxy server, measures latency
- HTTPS handshake — Sends the CONNECT request to the proxy
- Authentication — Handles proxy auth (407 response → sends credentials)
- Credential check — Verifies credentials were accepted (HTTP 200)
- Target connection — Reaches the target through the proxy end-to-end
All steps show a green checkmark on success with detailed status messages. The total latency is displayed at the top right (e.g. 99 ms), and a summary line confirms the result: PASSED — All tests OK.
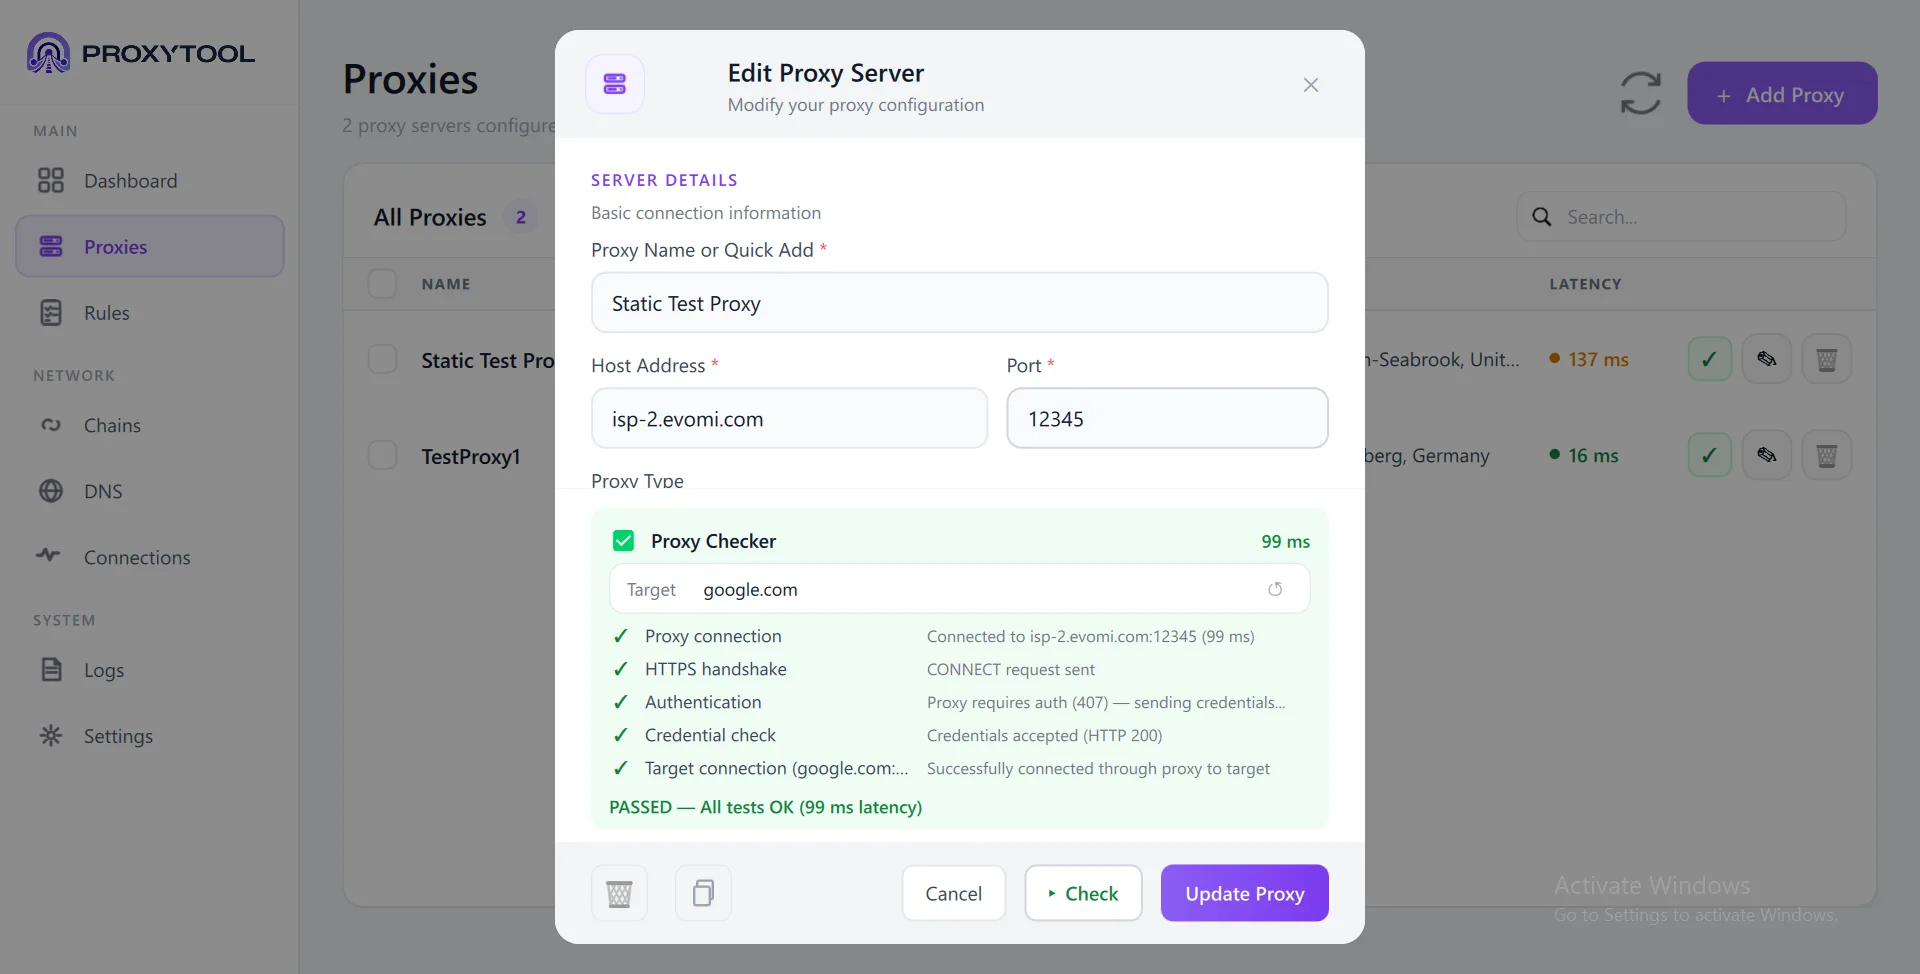 Inline Proxy Checker — all 5 tests passed (99 ms latency) with target google.com · Click to enlarge
Managing Proxies
The Proxies page displays all configured proxy servers in a sortable table with real-time status indicators.
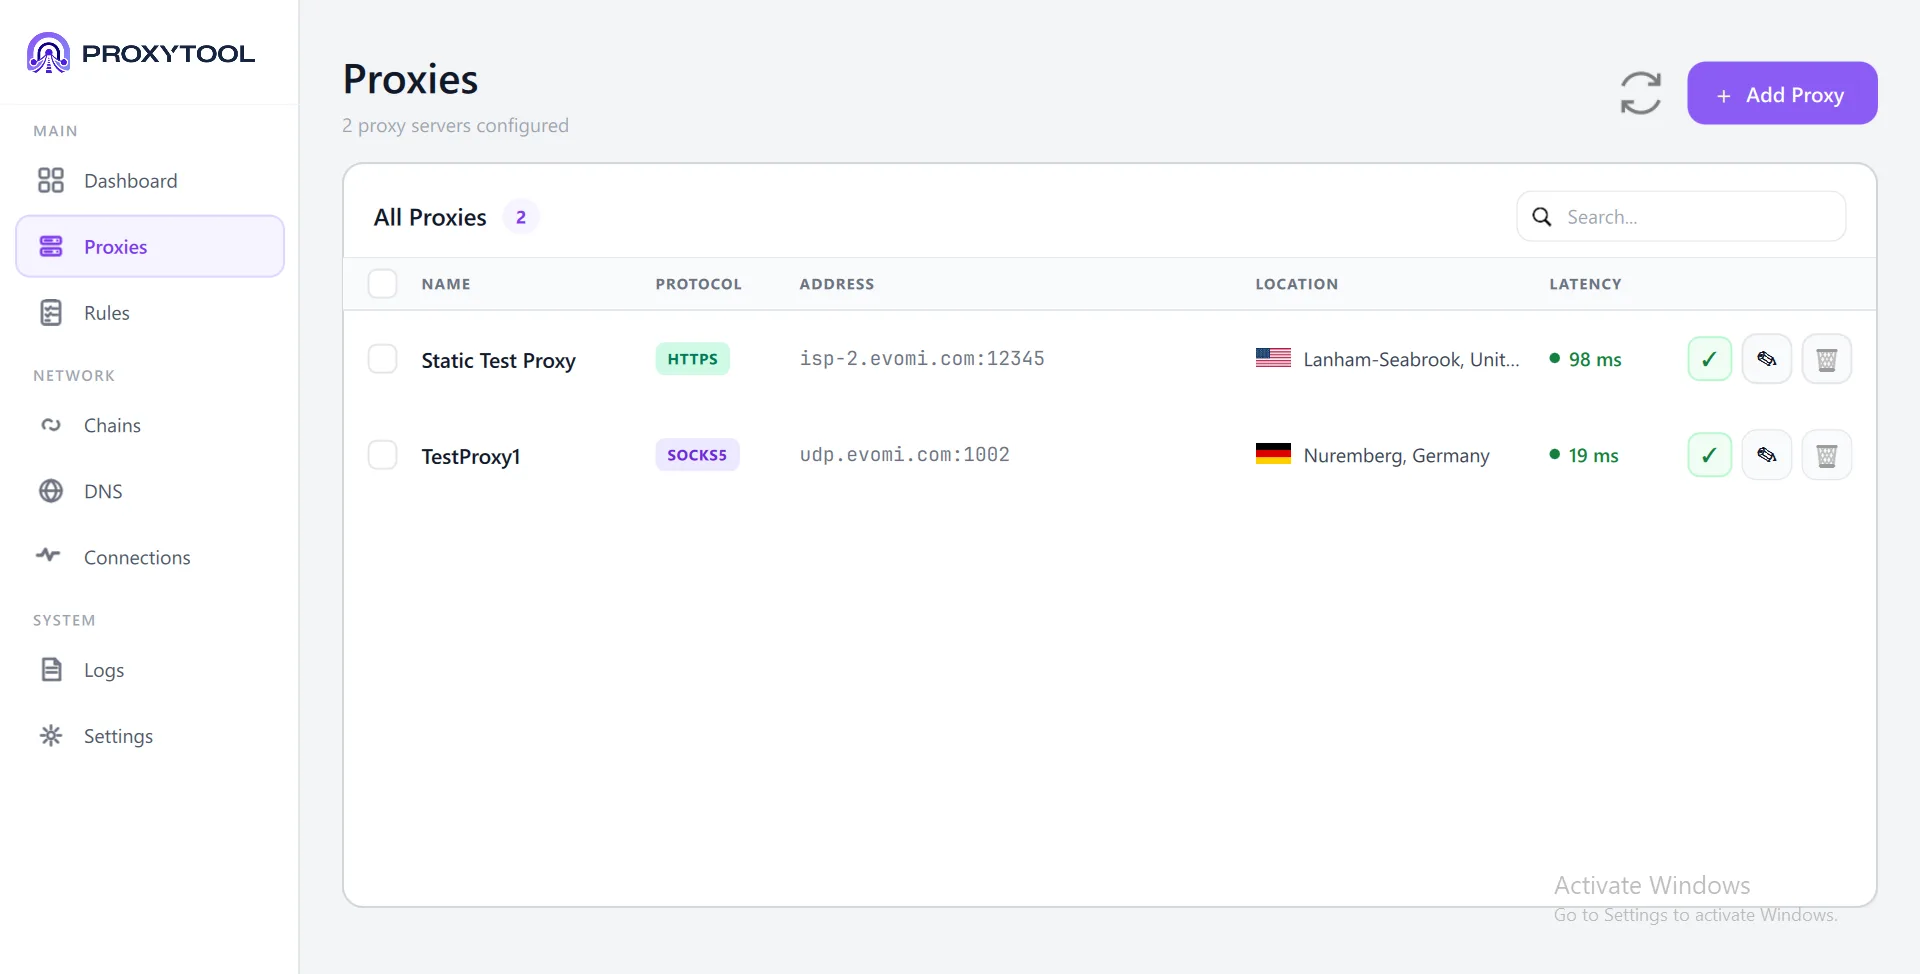 Proxies — Server list with protocol, address, location, latency, and quick actions · Click to enlarge
Table Columns
| Column | Shows |
|---|---|
| Name | Display name you assigned |
| Type | Protocol badge (HTTP, HTTPS, SOCKS4, SOCKS5) |
| Address | host:port |
| Location | Country flag + city (auto-detected via GeoIP lookup) |
| Status | Active (green dot) or Inactive (gray dot) |
| Latency | Response time in ms, color-coded (green/yellow/red) |
| Actions | Toggle on/off, Edit, Delete, Test |
Filters & Search
- Search — Filter by name, address, or location
- Type filter — All / HTTP / HTTPS / SOCKS4 / SOCKS5
- Status filter — All / Active / Inactive
Actions
- Toggle — Activates/deactivates the proxy (starts or stops the bridge)
- Edit — Reopens the Add Proxy dialog in edit mode with all fields pre-filled
- Delete — Stops the proxy if active, then removes it. Shows a warning if the proxy is used in chains or rules
- Test — Runs the connectivity checker without opening the dialog
Routing Rules
Rules determine which traffic goes through which proxy (or chain), goes direct, or gets blocked. They are evaluated top-to-bottom by priority — the first matching rule wins. Click + Add Rule to open the configuration dialog.
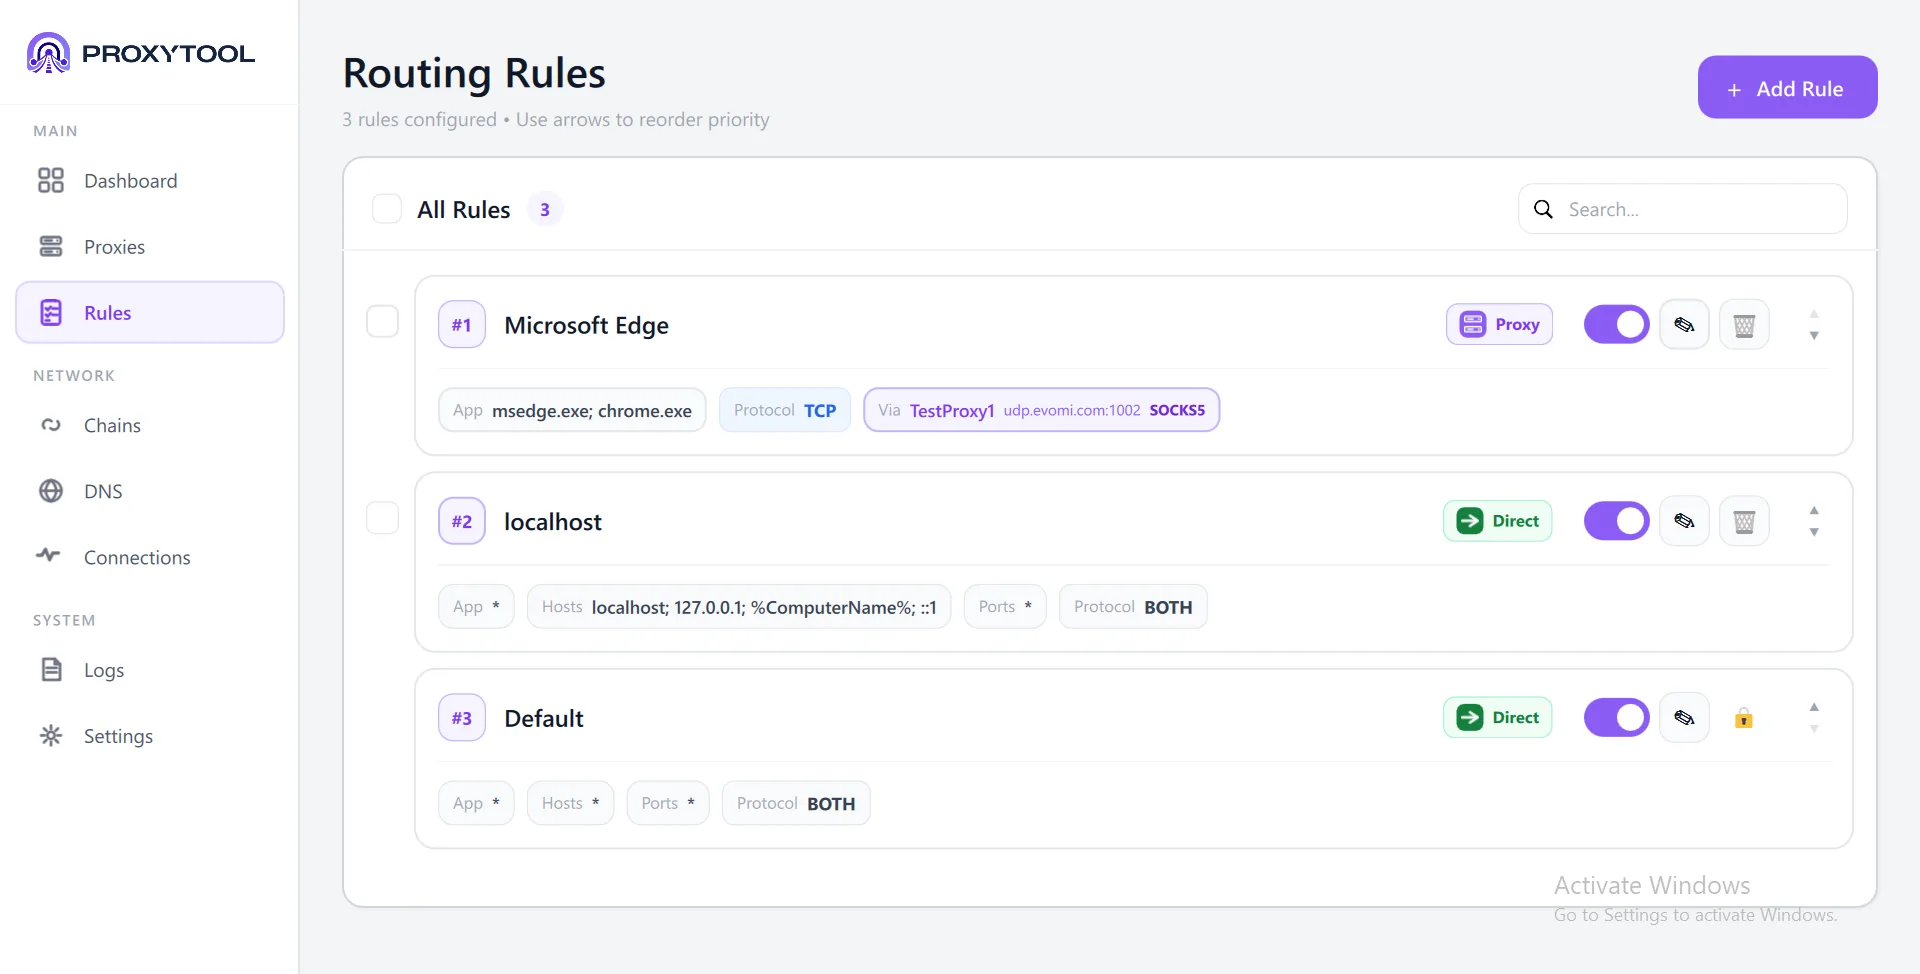
Rules Overview
The Rules page lists all configured routing rules with their priority number, action badge (Proxy / Direct / Block), on/off toggle, and summary tags showing matched apps, hosts, ports, and protocol. Use the up/down arrows on the right to reorder priorities — the first matching rule wins.
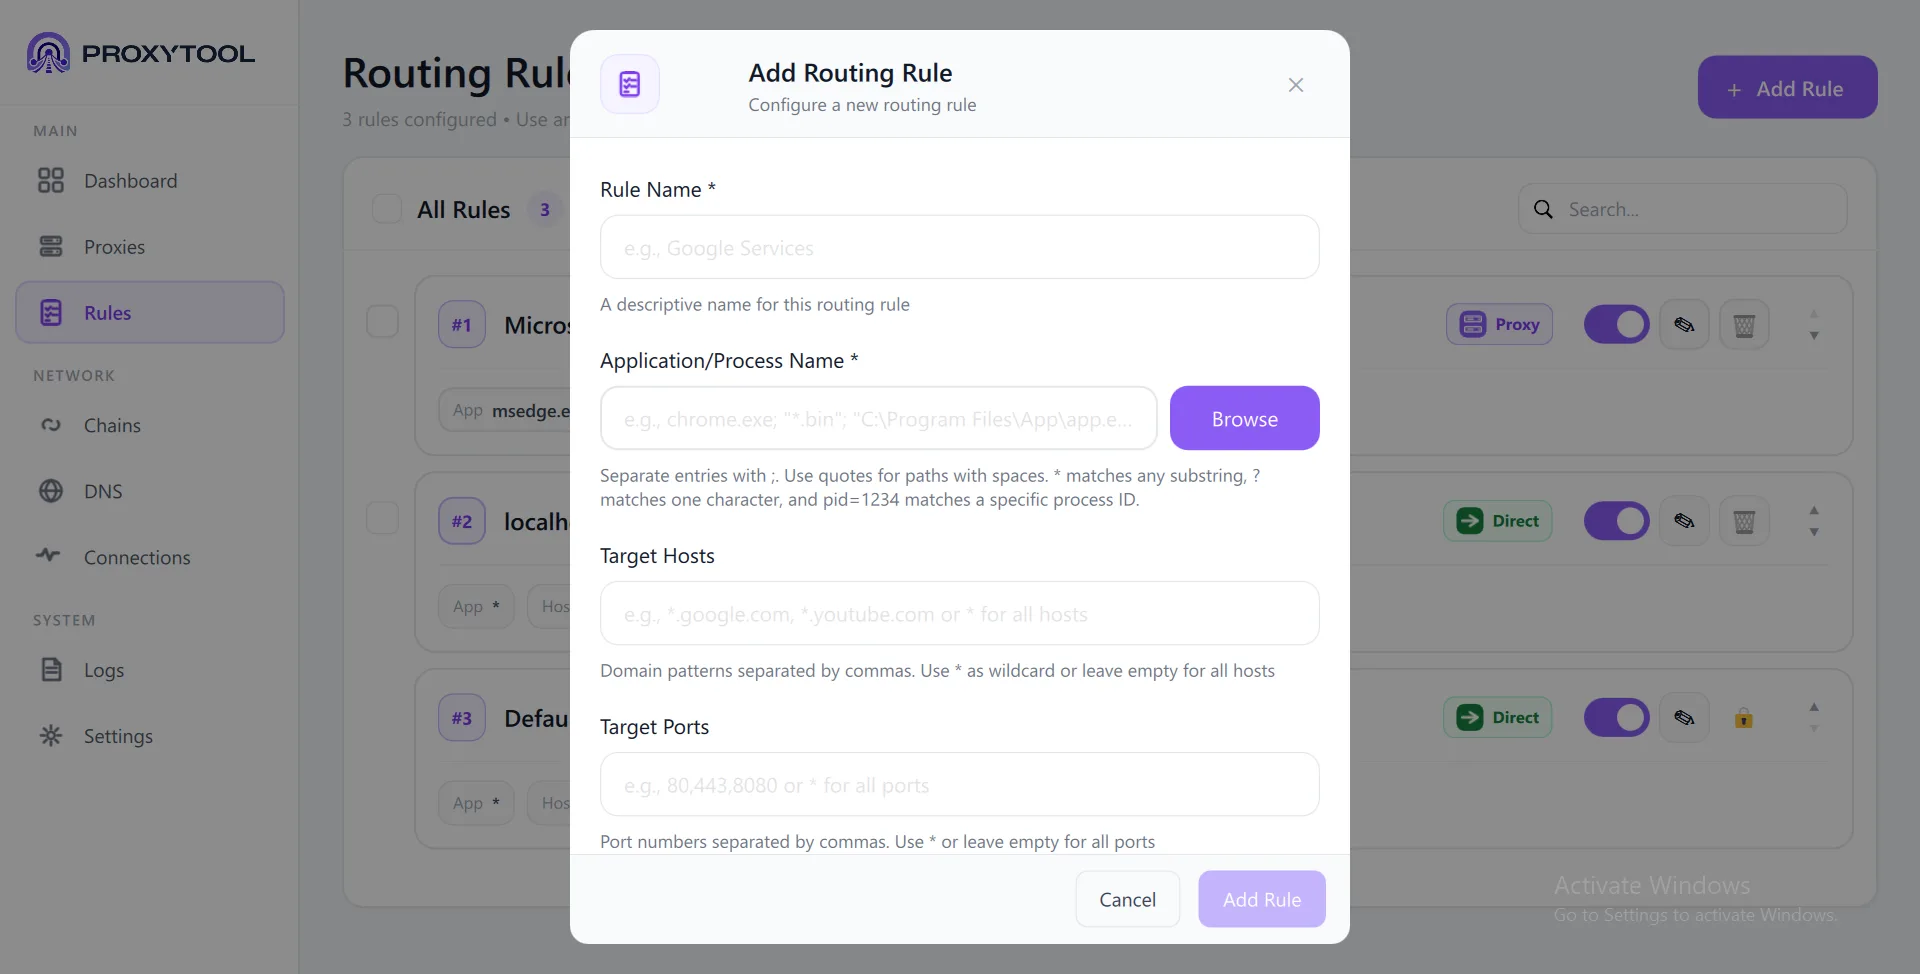
Rule Setup
The top half of the dialog defines what traffic this rule matches. All four criteria are optional — leave a field empty (or *) to match everything.
| Field | Format | Examples |
|---|---|---|
| Rule Name | Descriptive label | Google Services, Dev Server |
| Application / Process | Name, path, wildcards (*, ?), multiple separated by ;. Use Browse to pick an EXE. |
chrome.exe; msedge.exe, *bin*, pid=1234 |
| Target Hosts | Domain patterns, comma-separated. * = all hosts. |
*.google.com, api.example.org |
| Target Ports | Numbers, comma-separated. * = all ports. |
80,443,8080 |
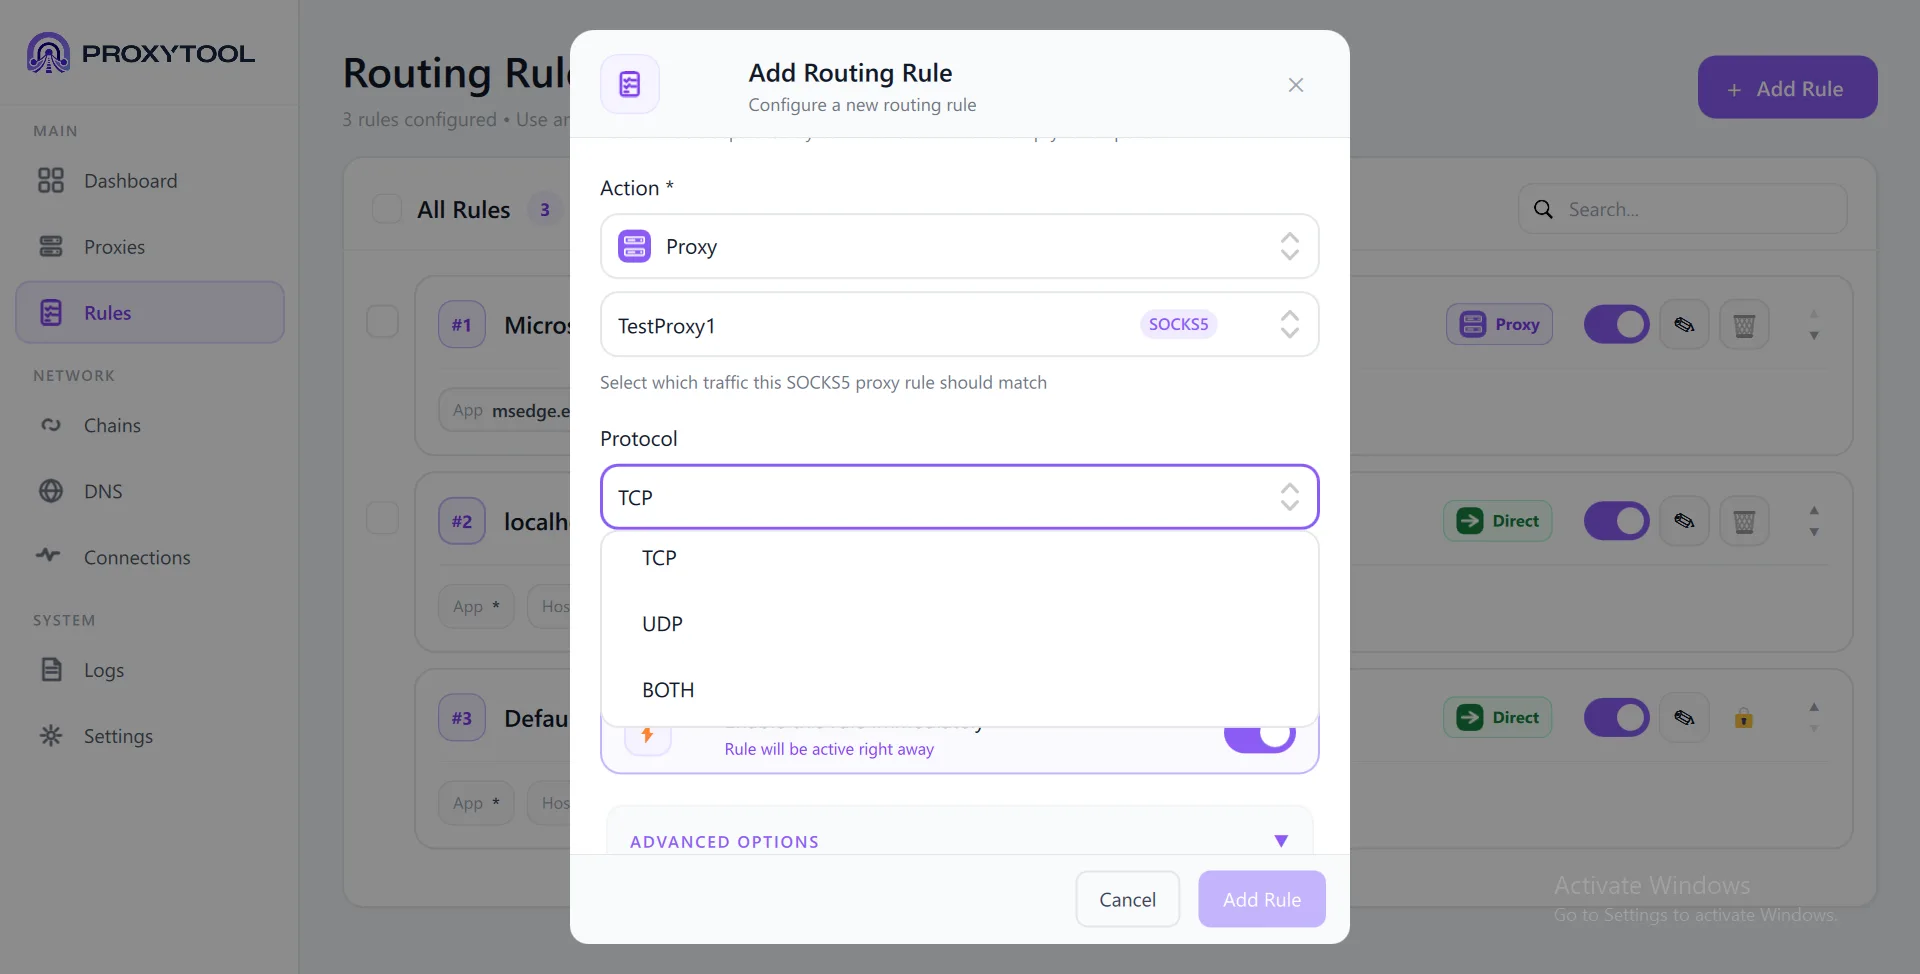
Protocol
Select which transport protocol this rule applies to. The dropdown offers TCP, UDP, or BOTH. Note that UDP routing requires a SOCKS5 proxy — HTTP and SOCKS4 proxies only support TCP.
.dmp logs of all proxied TCP and UDP connections. Useful for verifying that game, VoIP, or streaming traffic is actually routed through your proxy.
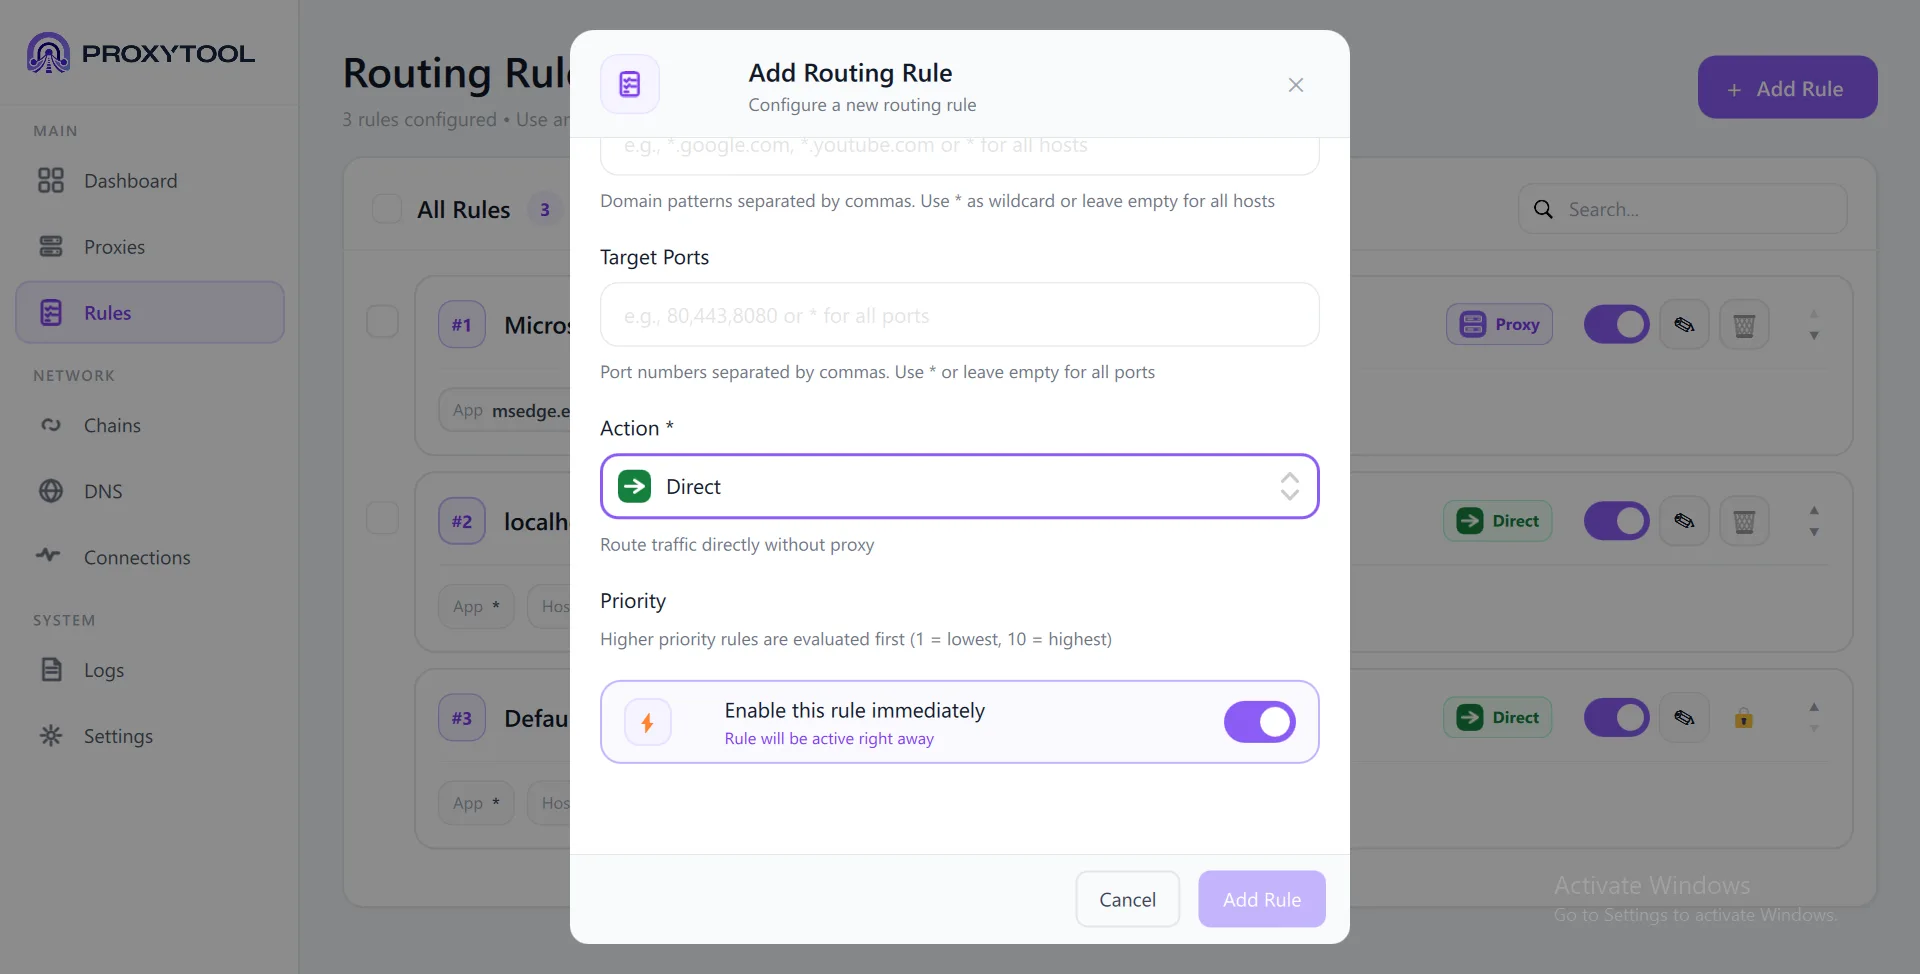
Actions
The Action dropdown defines how matched traffic is routed. Each action type shows different follow-up options:
| Action | What it does | Follow-up options |
|---|---|---|
| Direct | Bypass proxy — traffic goes straight to the destination | Priority, Enable toggle |
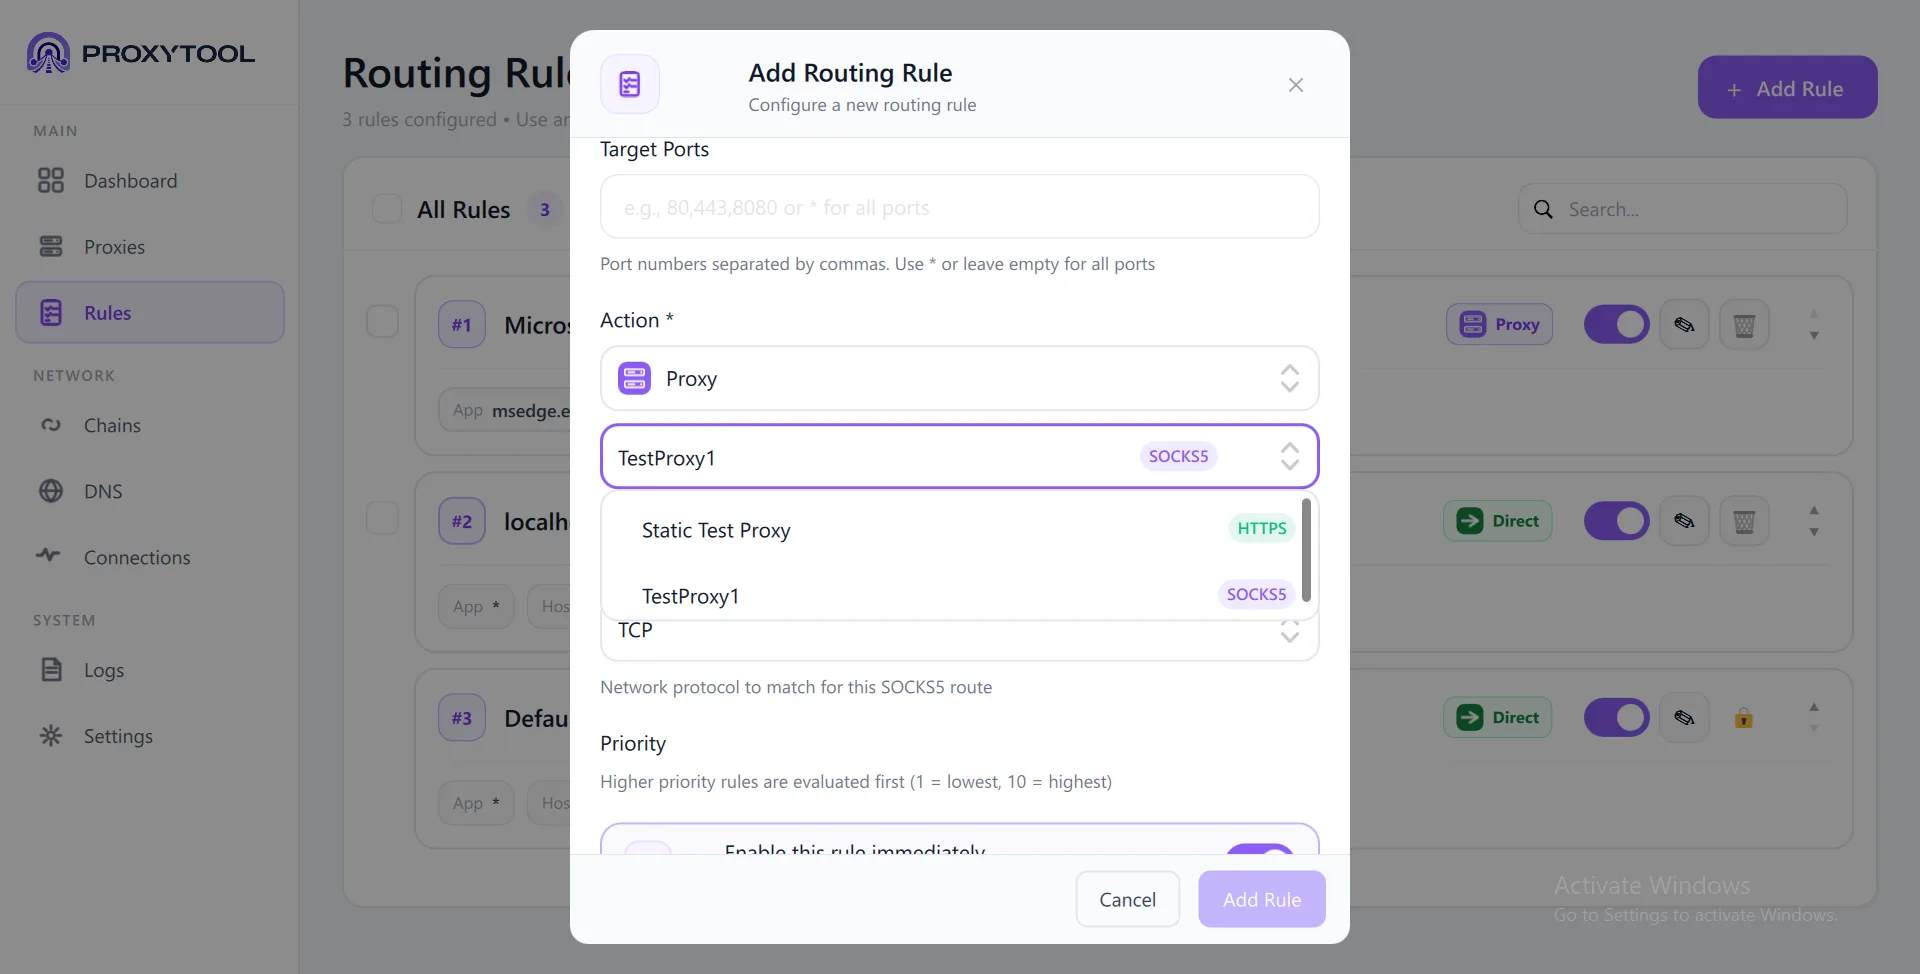
| Proxy | Route through a specific proxy server | Proxy selector (shows all configured servers with protocol badge), Protocol (TCP/UDP/BOTH), Priority, Enable toggle, Advanced Options |
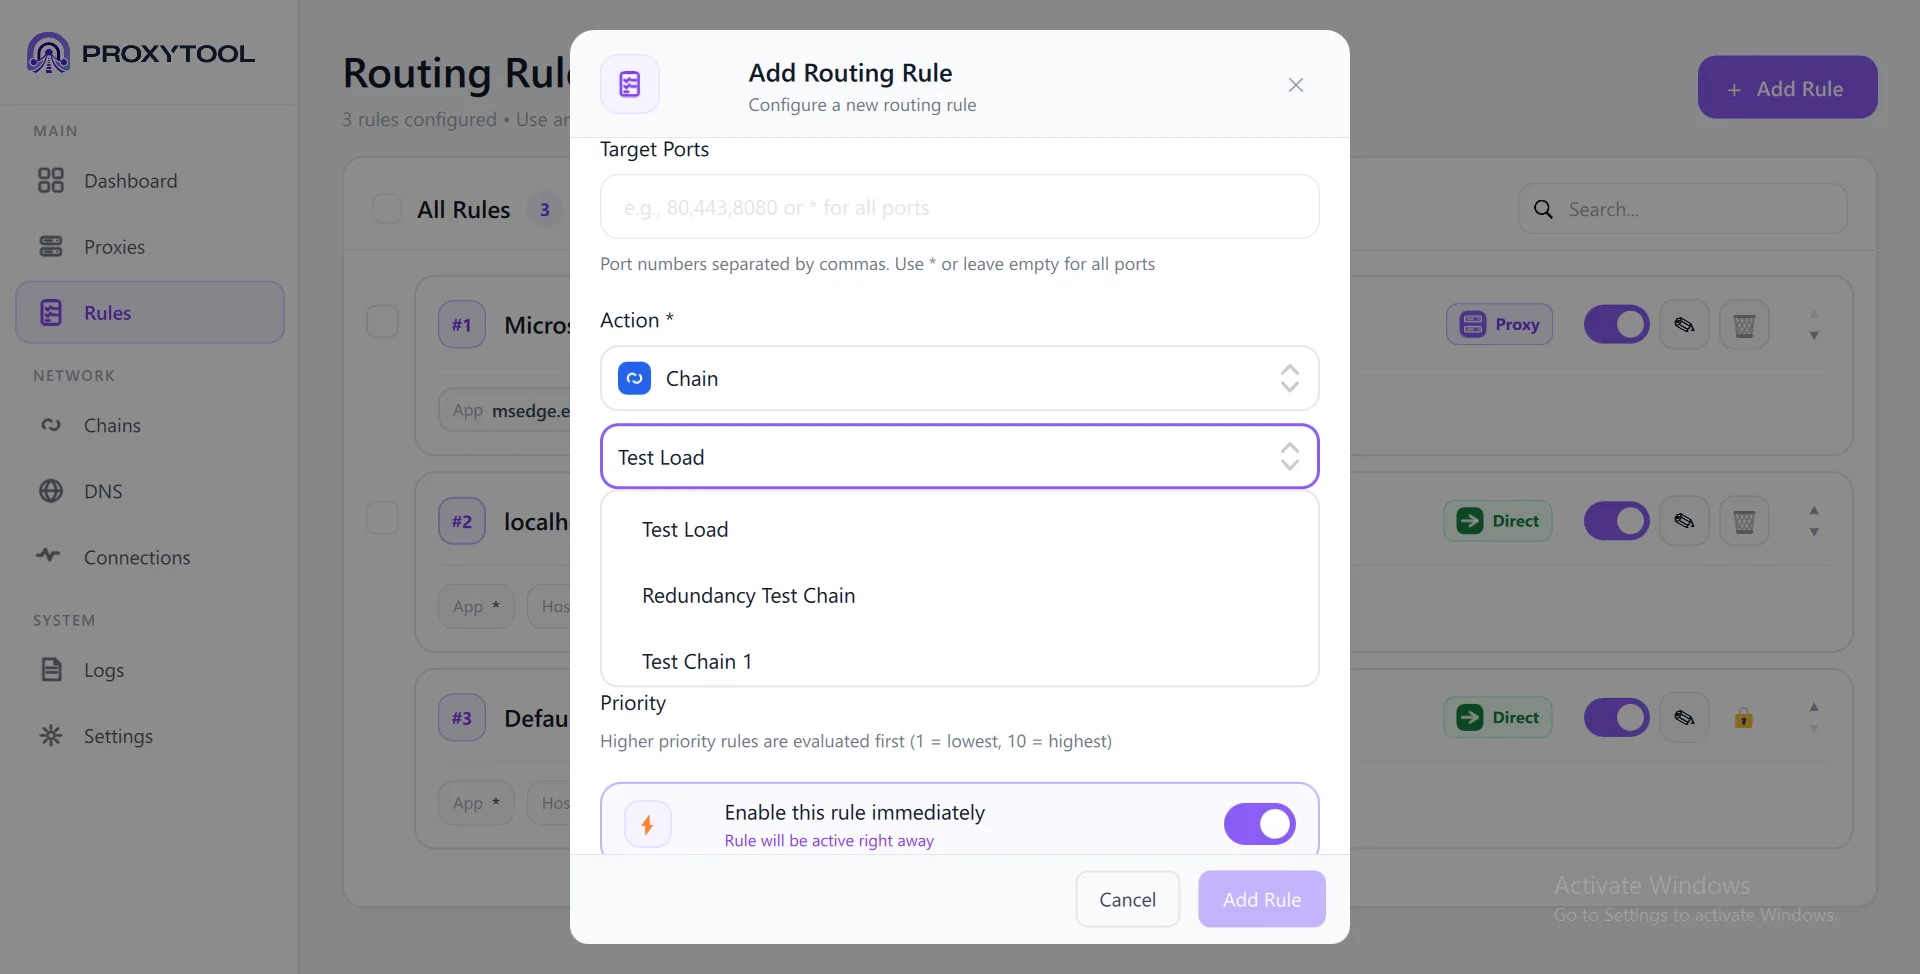
| Chain | Route through a proxy chain | Chain selector (shows all configured chains), Priority, Enable toggle, Advanced Options |
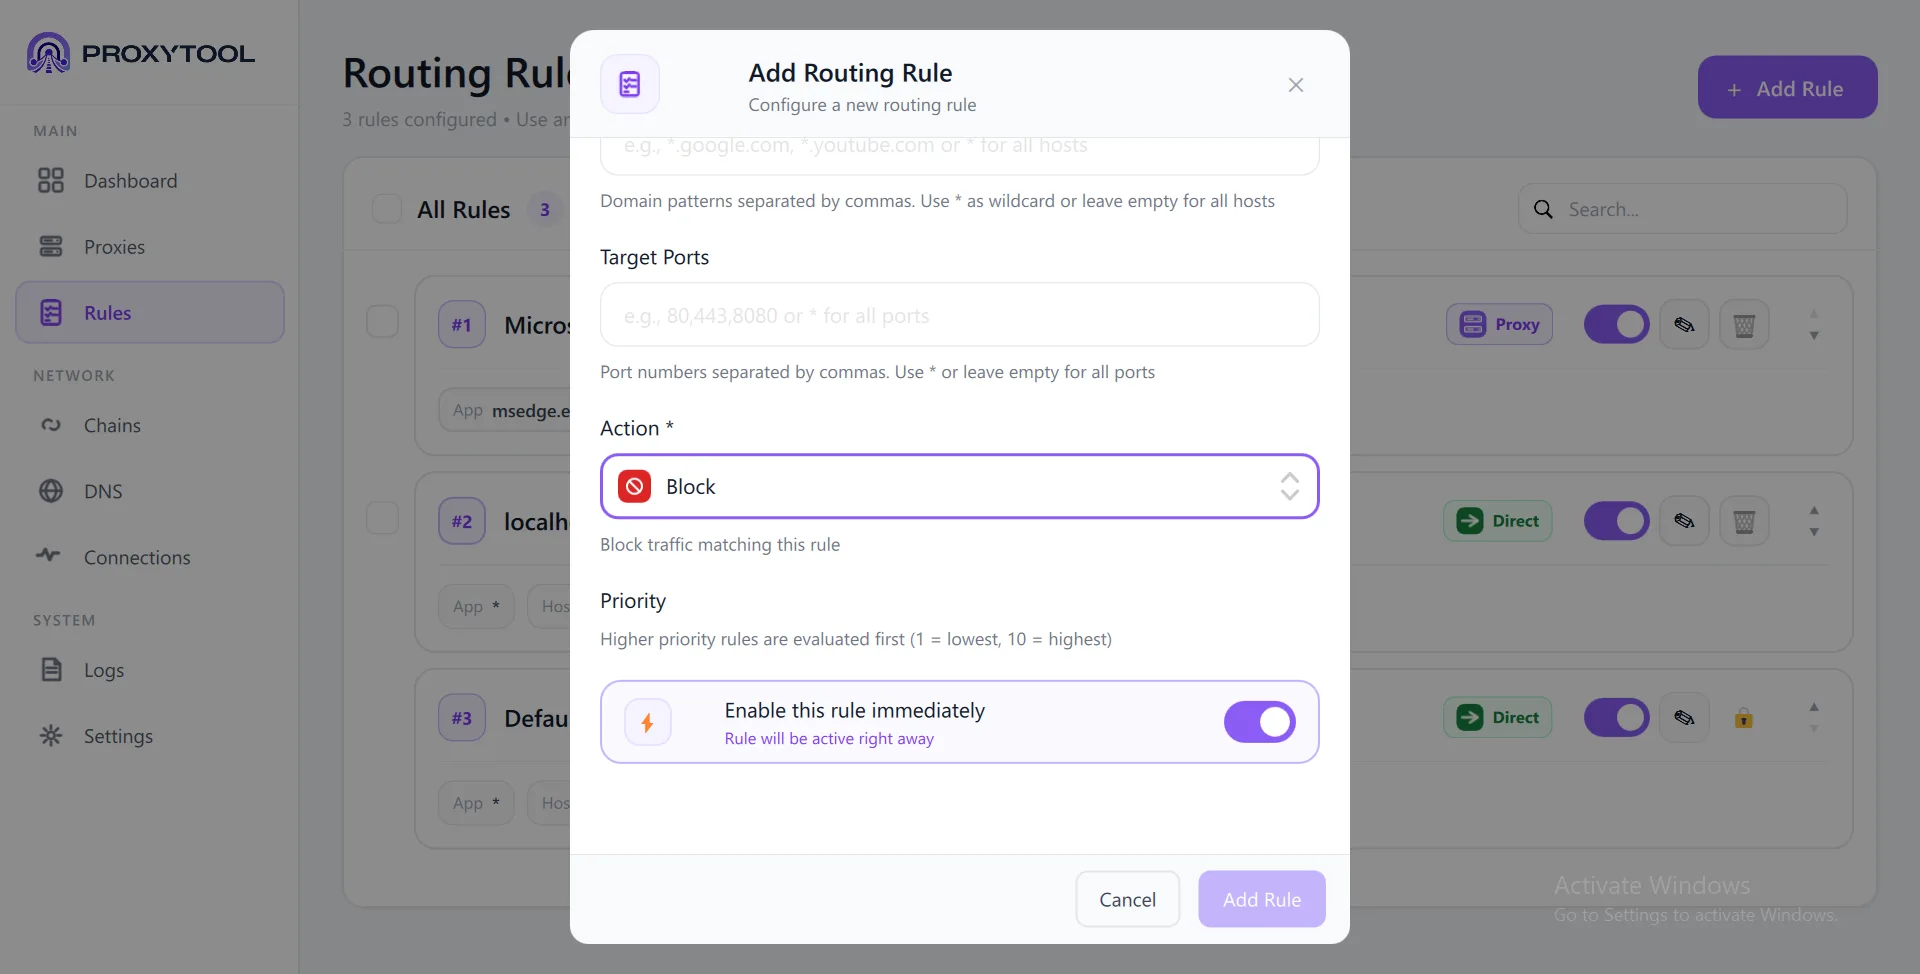
| Block | Drop the connection — app receives connection refused | Priority, Enable toggle |
When selecting Proxy, the dropdown lists all configured servers with their protocol badge (HTTPS, SOCKS5). When selecting Chain, you choose from your configured chain setups (Load Balancing, Redundancy, Simple).
Priority & Enable
Every rule has a Priority level (1 = lowest, 10 = highest). Higher priority rules are evaluated first. The Enable this rule immediately toggle (on by default) activates the rule right after creation — disable it to save a rule for later use.
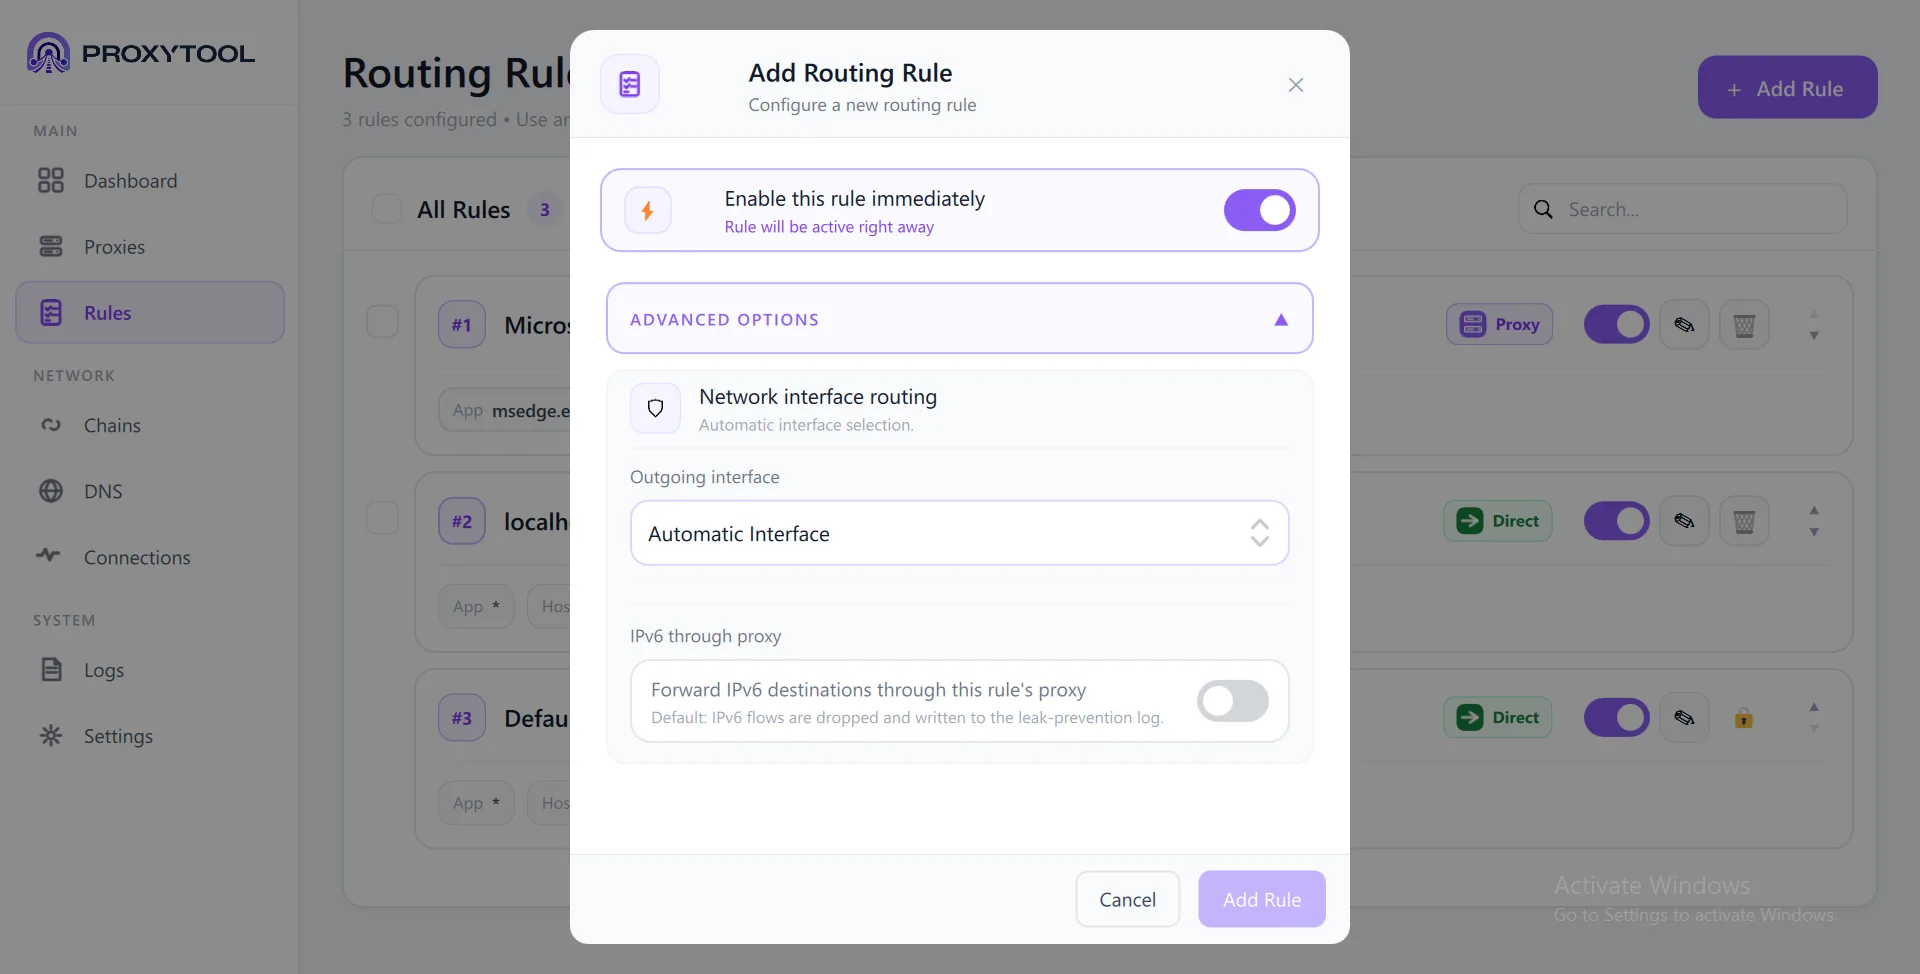
Advanced Routing Options
Expand Advanced Options at the bottom of the Add Rule dialog (available for Proxy and Chain actions) to access network interface control and IPv6 settings.
| Option | Default | Description |
|---|---|---|
| Outgoing Interface | Automatic Interface | Force this rule's traffic through a specific network adapter (e.g. WiFi, Ethernet, VPN). Automatic lets the OS decide. |
| IPv6 through proxy | Off | Off: IPv6 connections are dropped and logged to the leak-prevention log. On: IPv6 traffic is forwarded through the rule's proxy or chain. |
Proxy Chains
Proxy chains combine multiple proxies into a single routing target. ProxyTool supports three chain types — Simple (sequential multi-hop), Redundancy (automatic failover), and Load Balancing (random distribution). Click + Add Chain to open the configuration dialog.
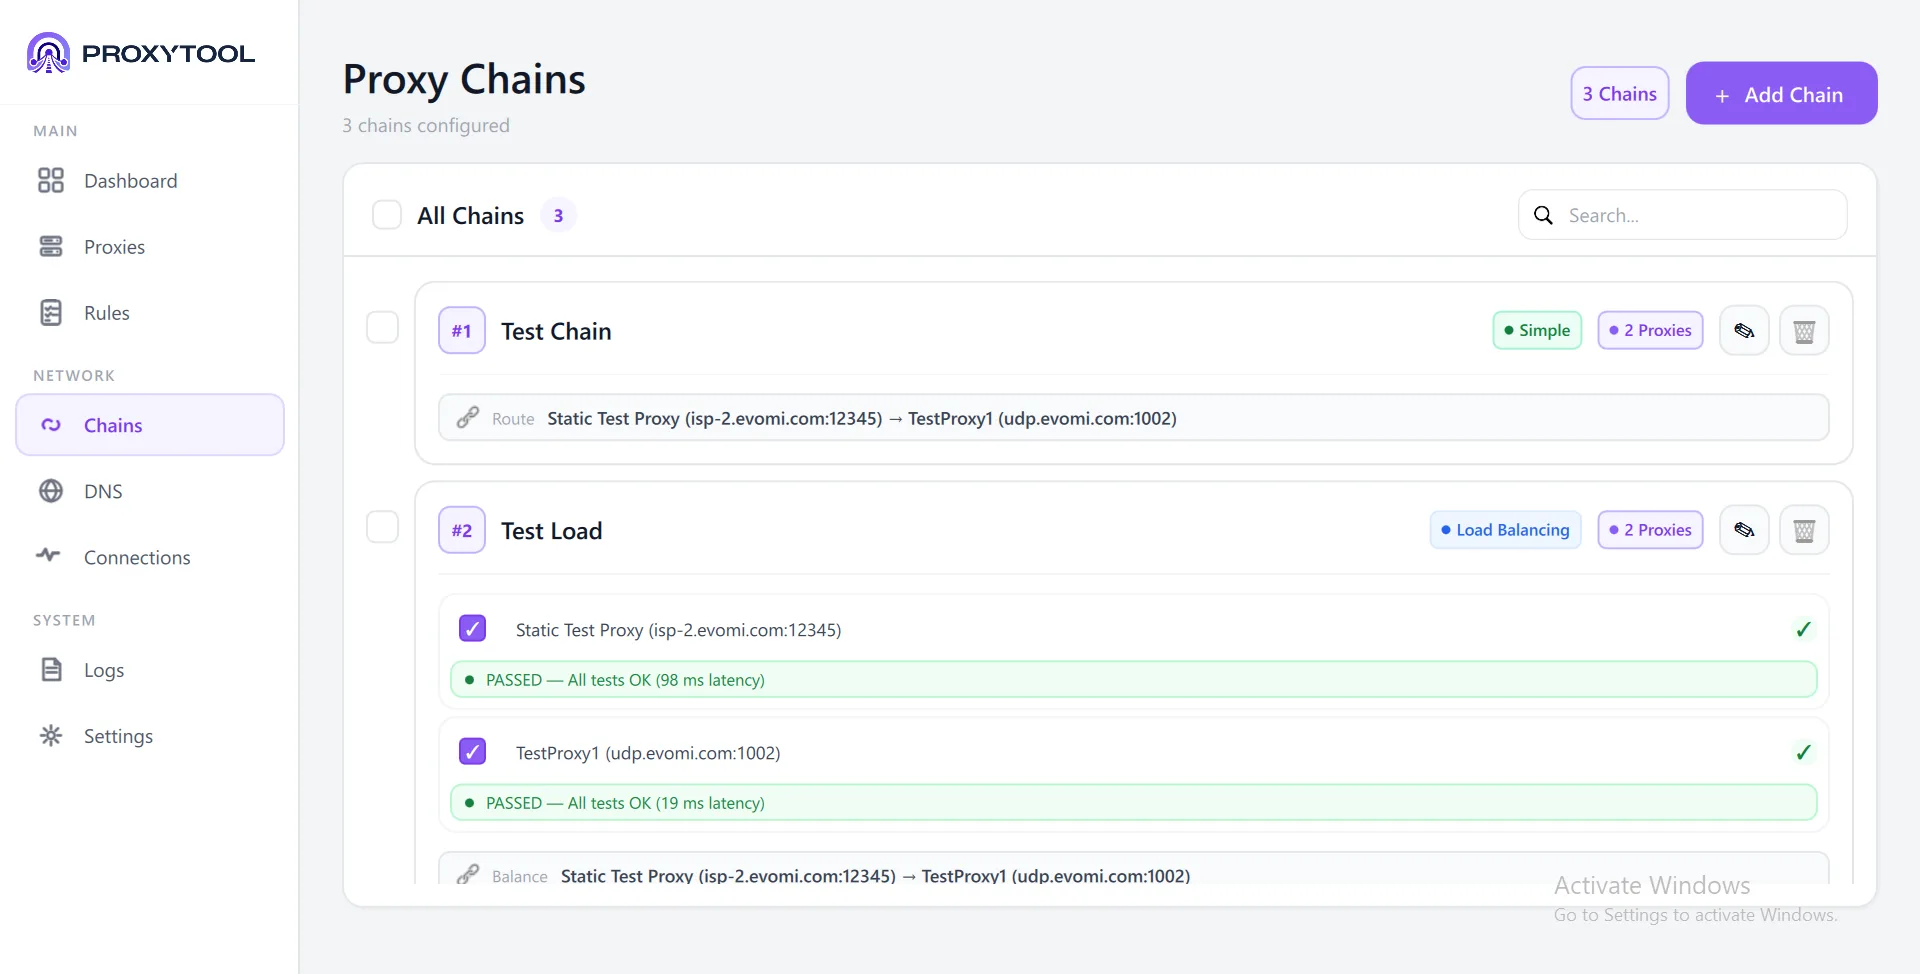

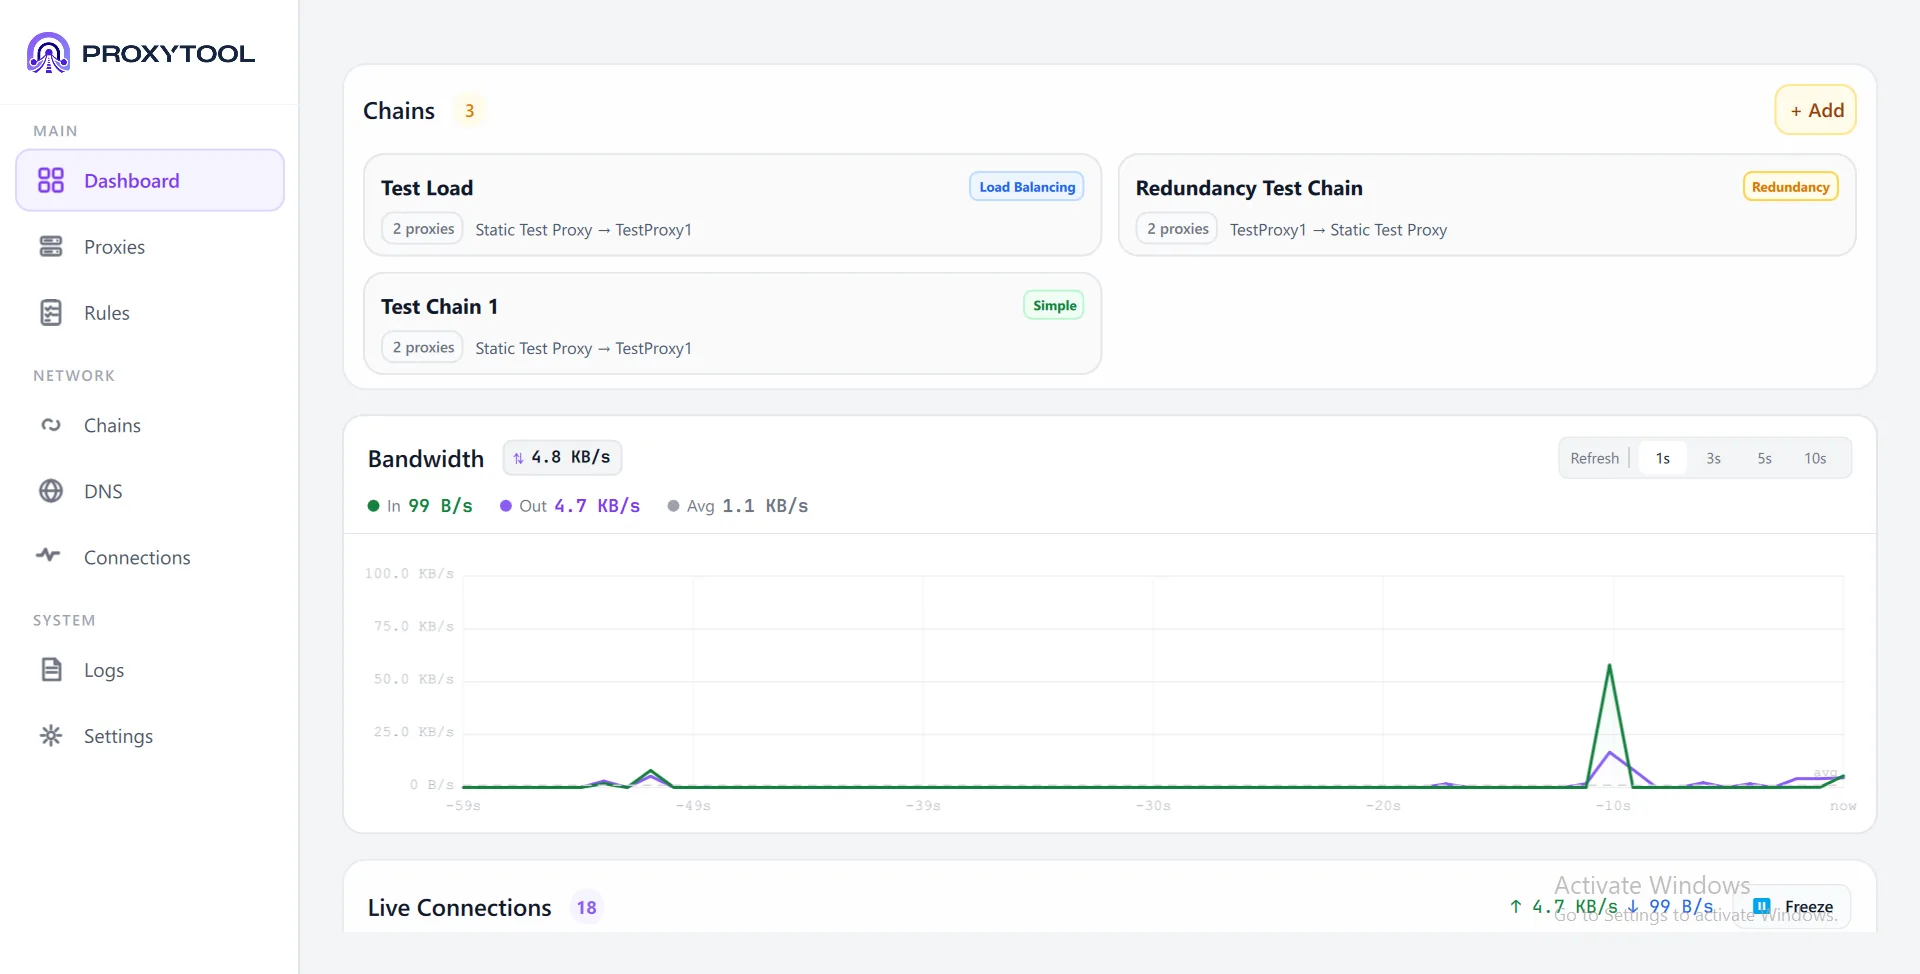
Chains Overview
The Chains page lists all configured chains with their type badge (Simple, Load Balancing, Redundancy), proxy count, and a route visualization showing the traffic path (e.g. Static Test Proxy → TestProxy1). Expand a chain to see per-proxy health status with test results and latency.
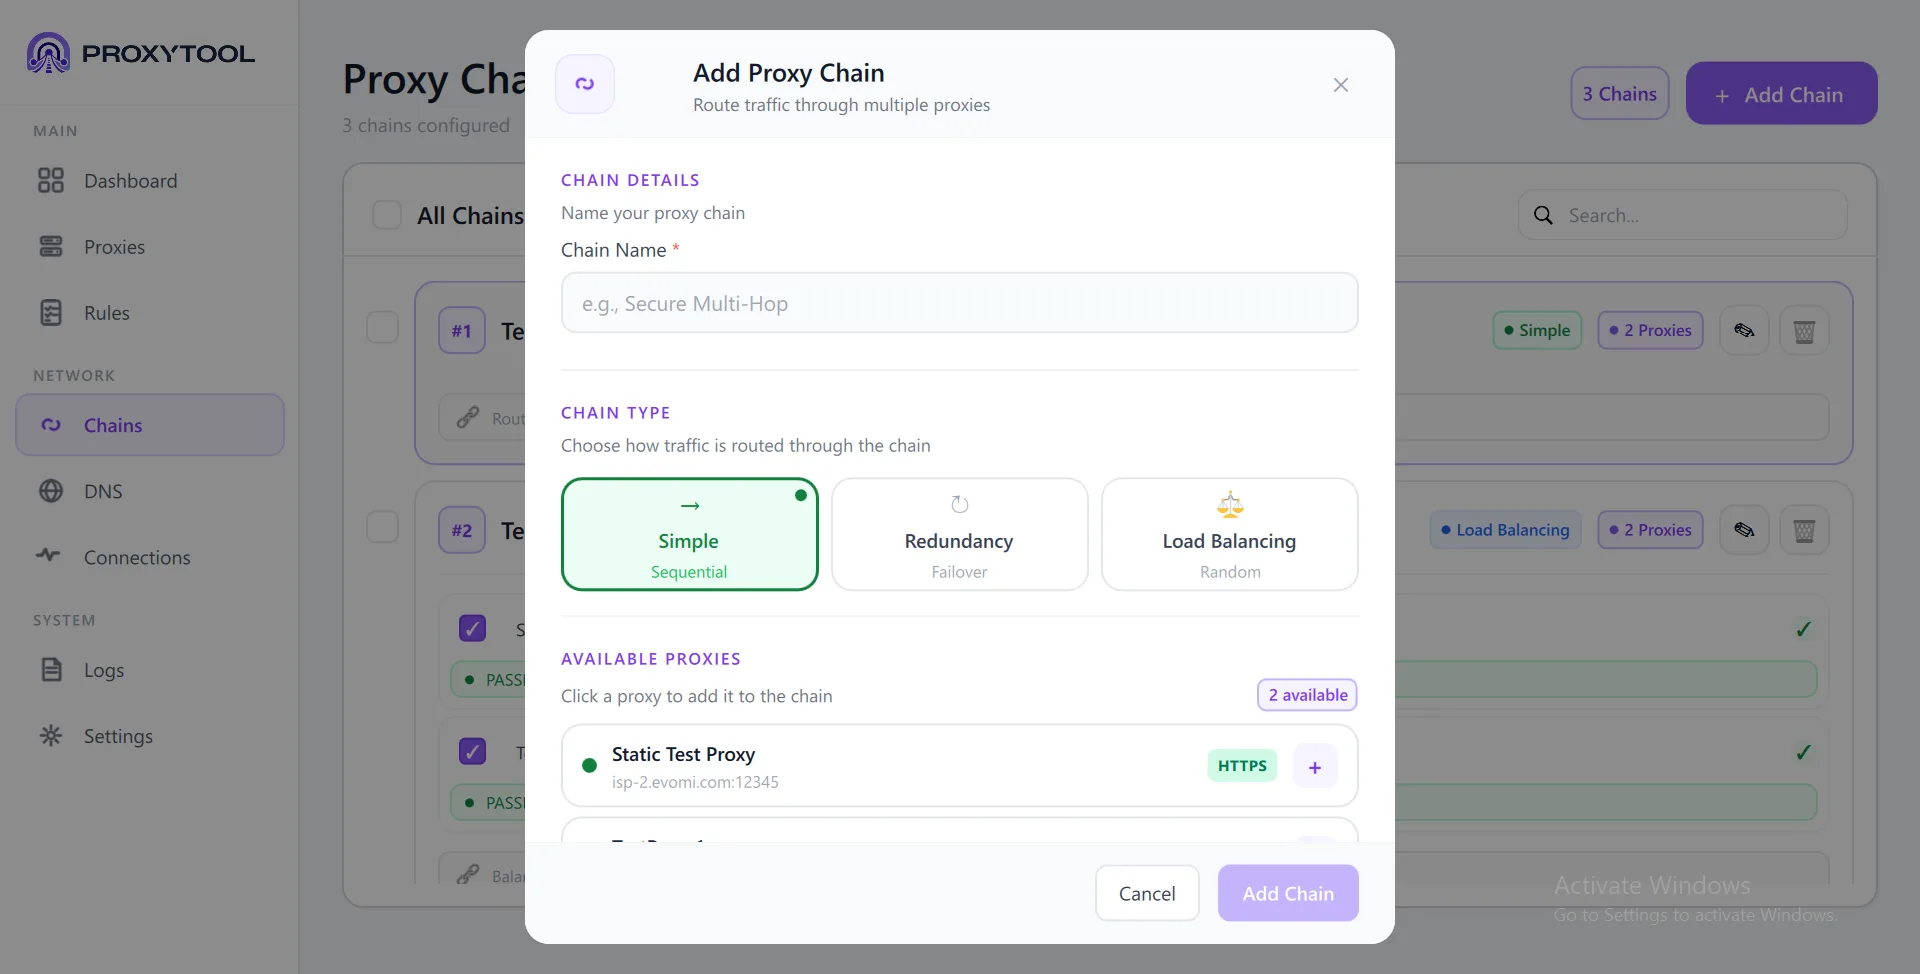
Chain Setup
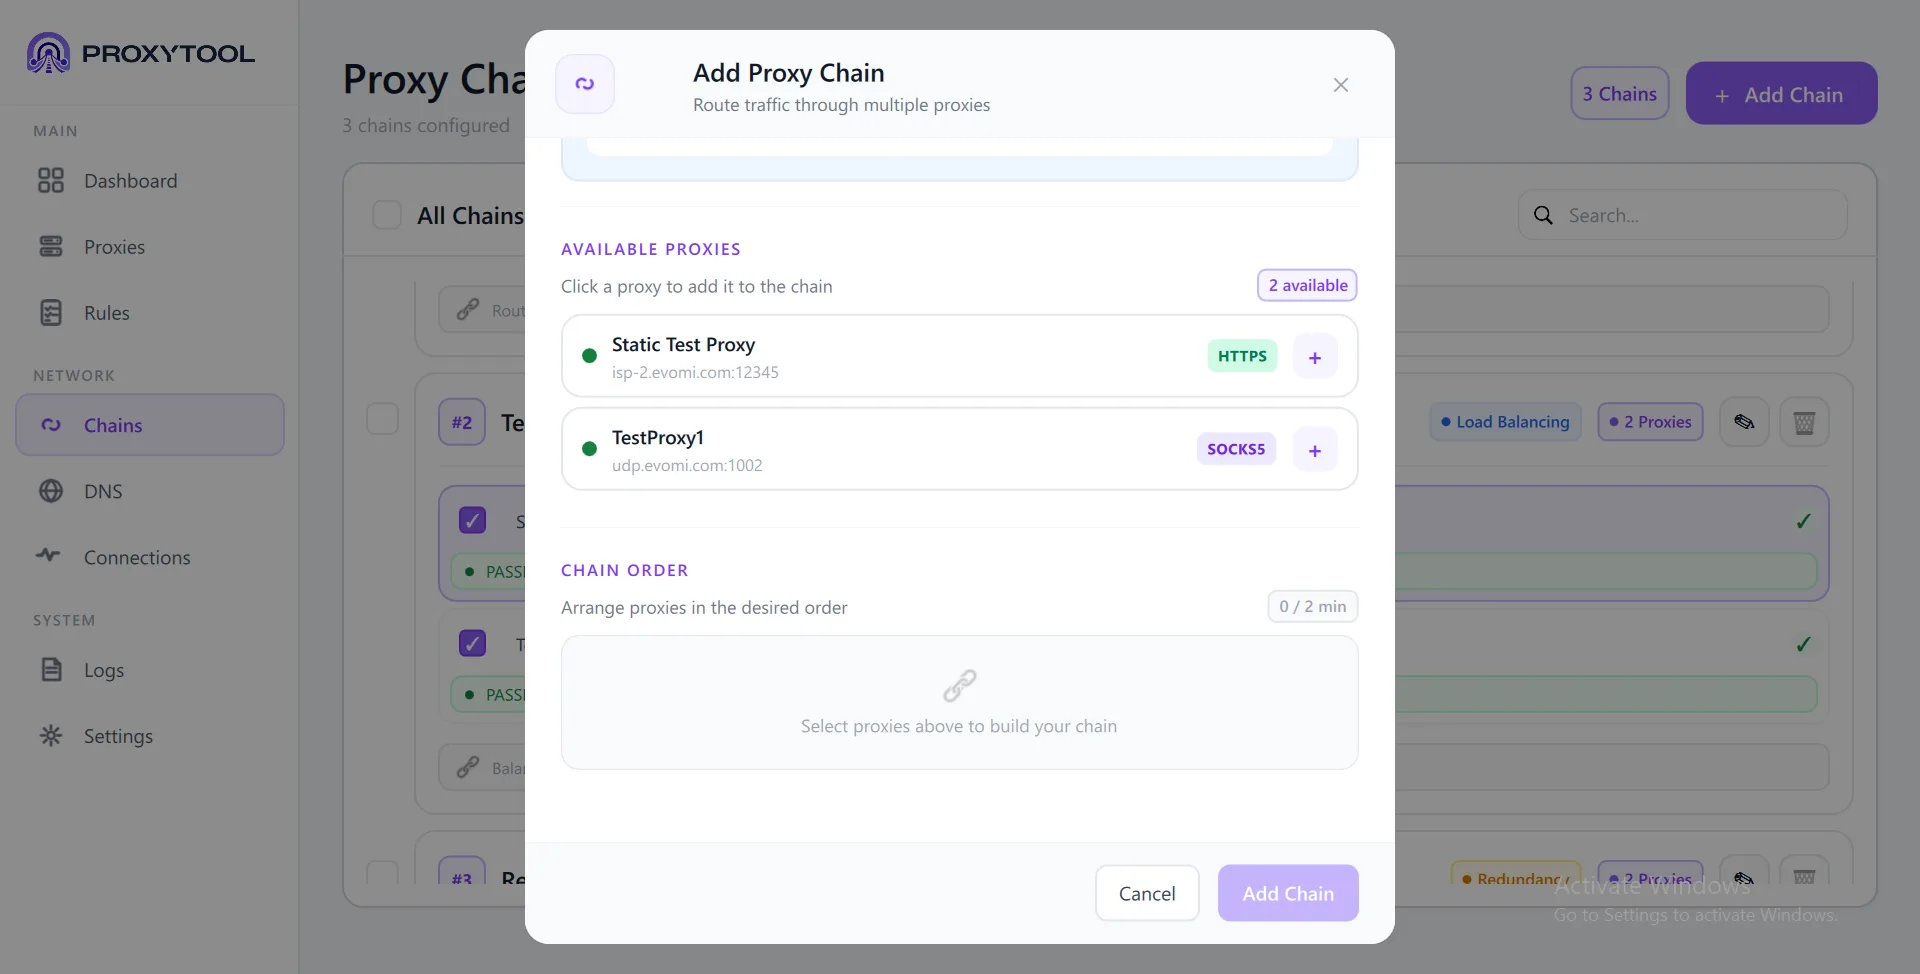
Enter a Chain Name, then select one of the three chain types. Each type shows its own configuration options below the selector. The Available Proxies panel lists all configured proxy servers — click the + button next to a proxy to add it to the chain.
| Aspect | Simple | Redundancy | Load Balancing |
|---|---|---|---|
| How it works | All proxies in sequence (multi-hop) | One proxy at a time (failover) | Random proxy per connection |
| Traffic flow | Client → A → B → Target | Client → first working proxy → Target | Client → random proxy → Target |
| Use case | Multi-hop anonymity | High availability / backup proxies | IP rotation / load distribution |
| On failure | Whole chain fails | Tries next proxy in order | Excludes failed proxy from pool |
| Order matters? | Yes — defines hop sequence | Yes — defines failover priority | No — random selection from pool |
Simple Sequential Chain
Routes traffic through every proxy in order as a true multi-hop chain. Each proxy becomes a hop between your device and the destination. Adds latency but increases anonymity. The order you set in the Chain Order section determines the hop sequence.
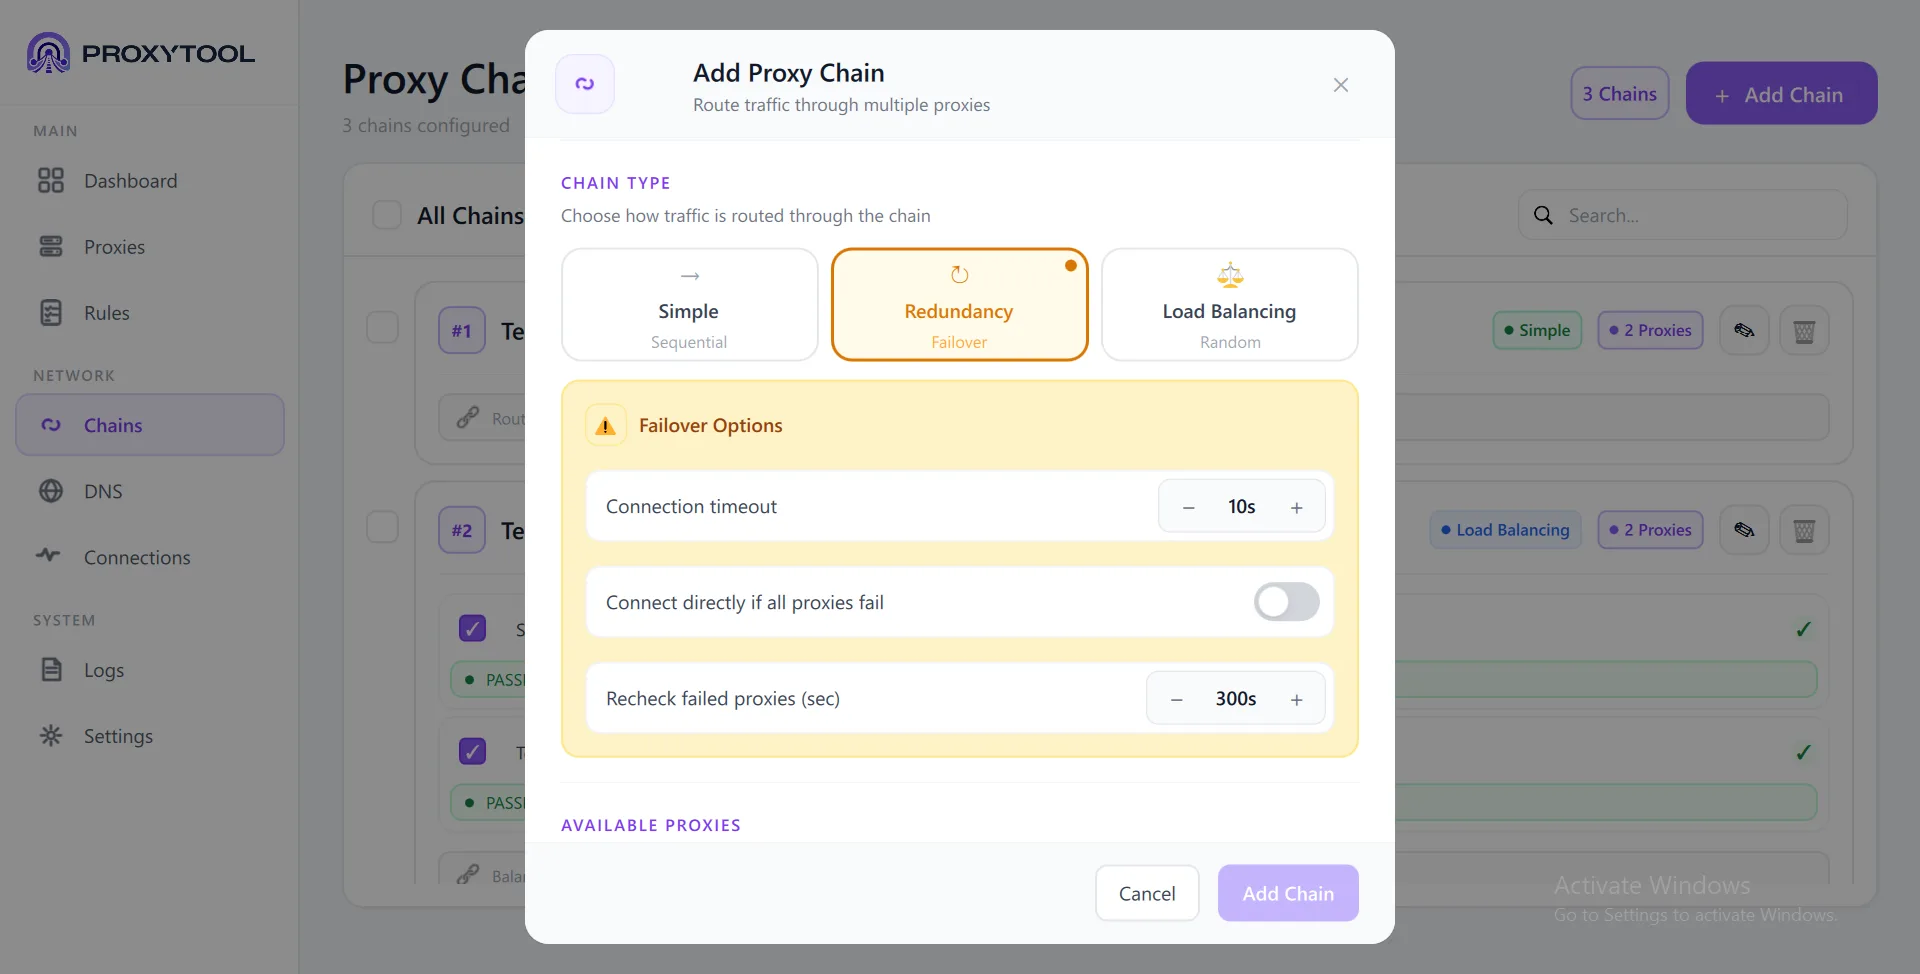
Redundancy Failover Chain
Uses one proxy at a time from the ordered list. Tries the first enabled proxy; if it fails validation within the timeout, automatically switches to the next.
| Option | Default | Description |
|---|---|---|
| Connection Timeout | 10s |
How long to wait before declaring a proxy failed. Adjustable with + / − buttons (1–120 seconds). |
| Connect directly if all fail | Off | On: bypass proxies entirely when all fail. Off: block the connection. |
| Recheck failed proxies | 300s |
Background timer re-tests failed proxies automatically. Set to 0 to disable. |
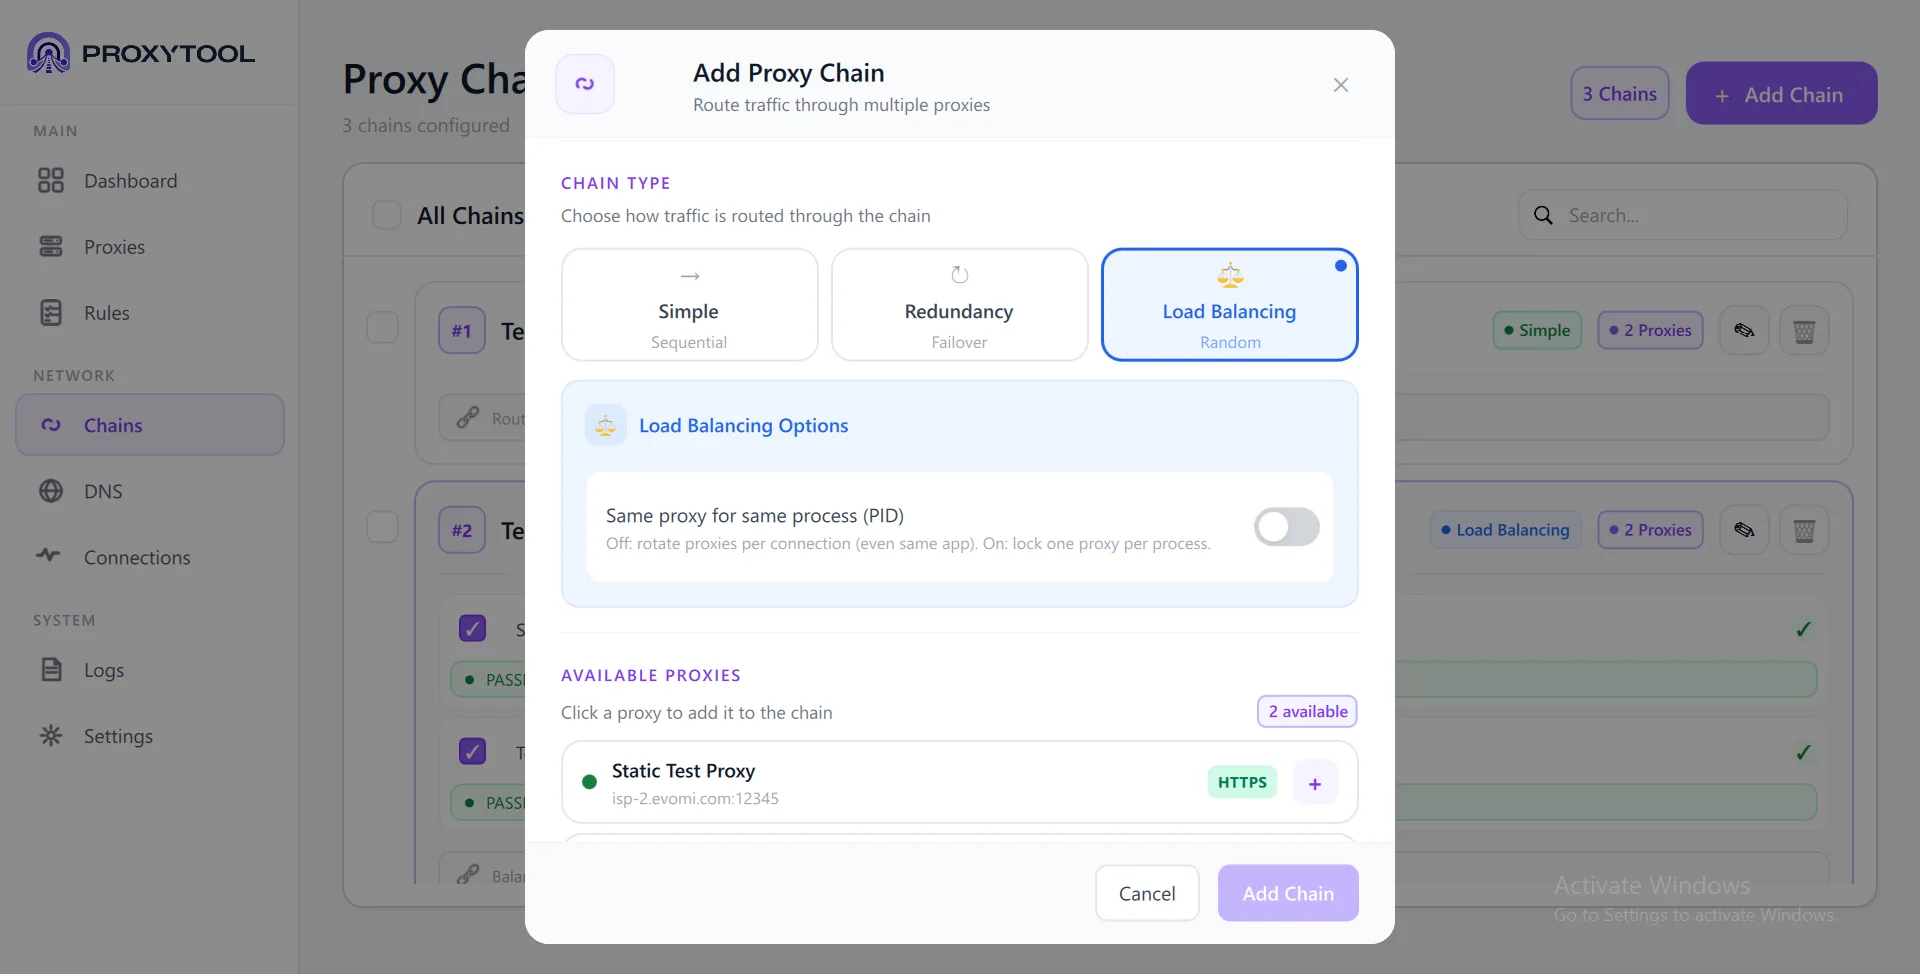
Load Balancing Random Distribution
Distributes connections across multiple parallel proxies. Each new connection gets assigned a random proxy from the pool.
| Option | Default | Description |
|---|---|---|
| Same proxy for same process (PID) | Off | Off: rotate proxy per connection (even within the same app). On: lock one proxy per process for session stickiness. |
Creating a Chain
Steps
- 1. Name your chain — Enter a descriptive name (e.g. "Secure Multi-Hop")
- 2. Select chain type — Simple, Redundancy, or Load Balancing — each shows its own configuration options
- 3. Add proxies — Click the + button next to a proxy in the "Available Proxies" panel. Proxies show their protocol badge (HTTPS, SOCKS5) and can only appear once per chain.
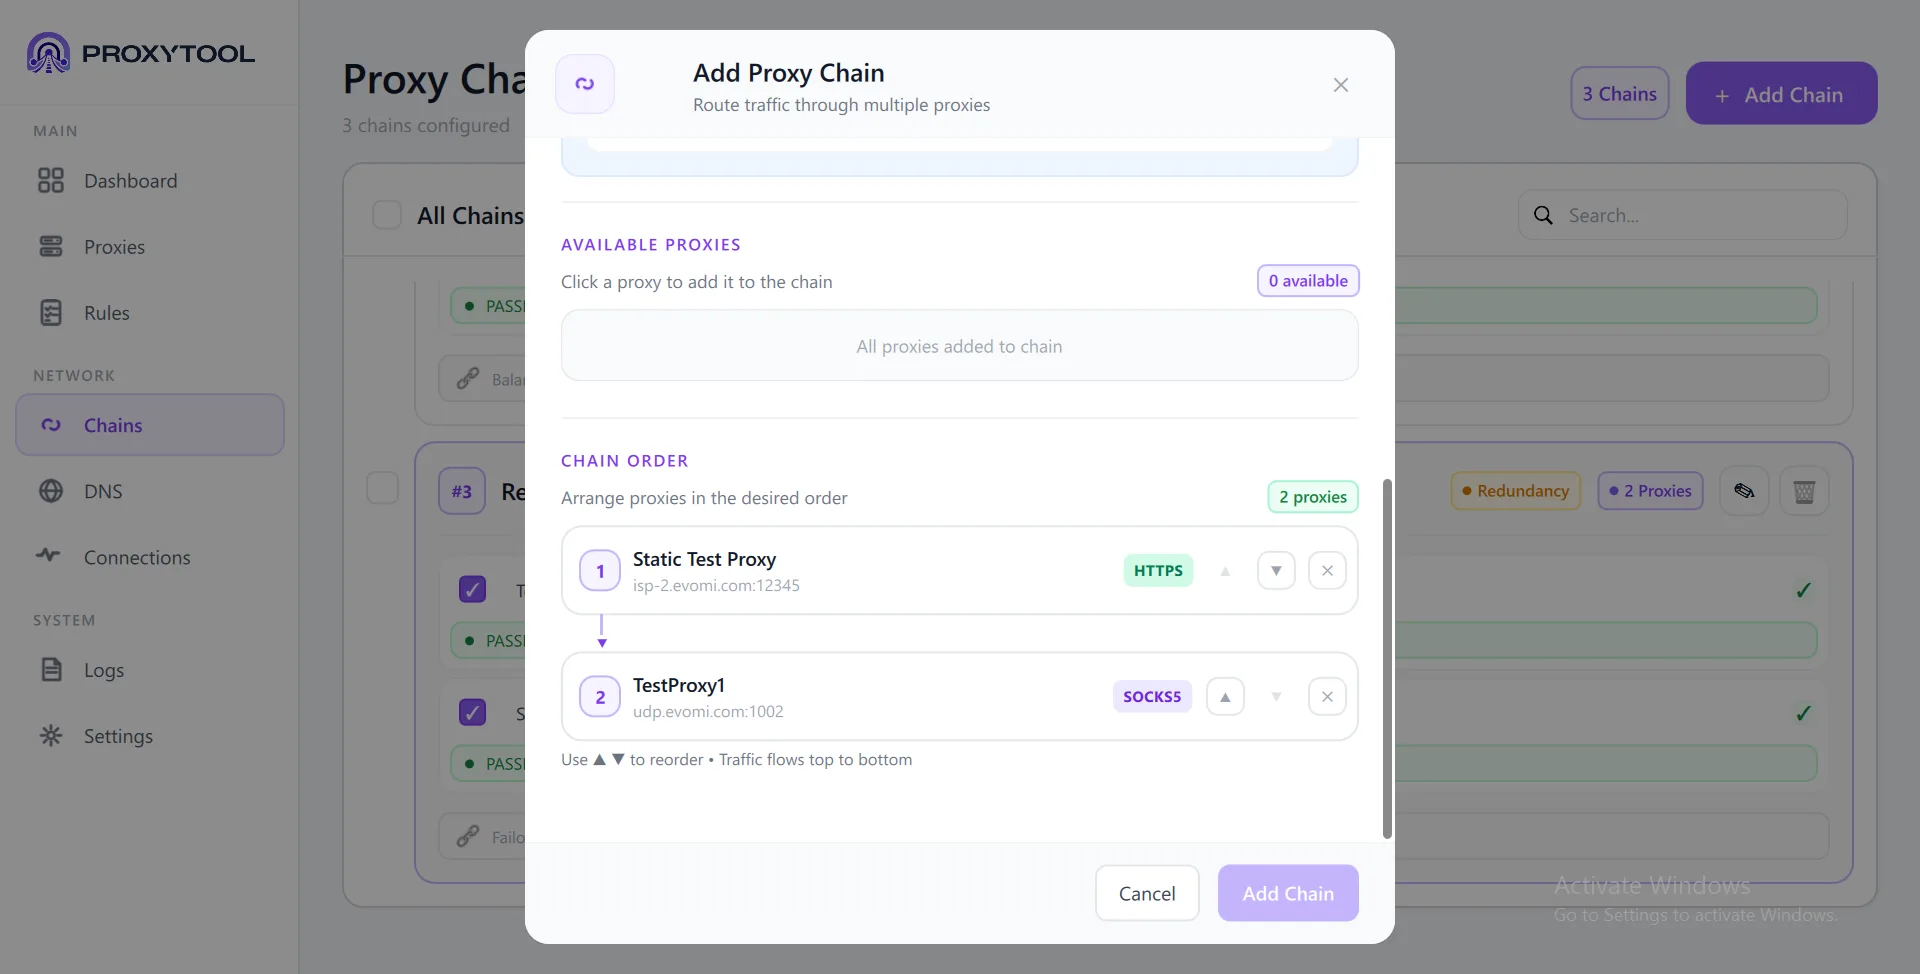
- 4. Set order — In the Chain Order section, use the ▲ ▼ arrow buttons to move proxies up or down. Traffic flows top to bottom. Click ✕ to remove a proxy from the chain.
- 5. Configure options — Set type-specific options (timeout for Redundancy, PID stickiness for Load Balancing)
- 6. Save — Click Add Chain. Assign the chain to a routing rule to start using it.
Chain Order
The Chain Order section shows all added proxies as numbered cards. Each card displays the proxy name, address, and protocol badge. Use the ▲ (up) and ▼ (down) arrow buttons to reorder — traffic flows from position 1 downward. A visual arrow connects the hops to illustrate the routing path. The counter (e.g. 2 proxies) shows how many are in the chain, with a minimum of 2 required.
Chain List Features
- Type badge — Color-coded: Simple, Load Balancing, Redundancy
- Route visualization — Shows the proxy flow:
Proxy A → Proxy B → ... - Per-proxy health — Expand a chain to see individual proxy test results with latency, e.g. PASSED — All tests OK (98 ms)
- Edit / Delete — Edit reopens the dialog, Delete removes the chain. Shows a warning if the chain is used in routing rules.
DNS & Name Resolution
The DNS page controls how hostnames are resolved and provides leak-prevention features that keep your real IP address hidden. Three tabs at the top let you switch between detection modes, while the settings below fine-tune privacy behaviour.
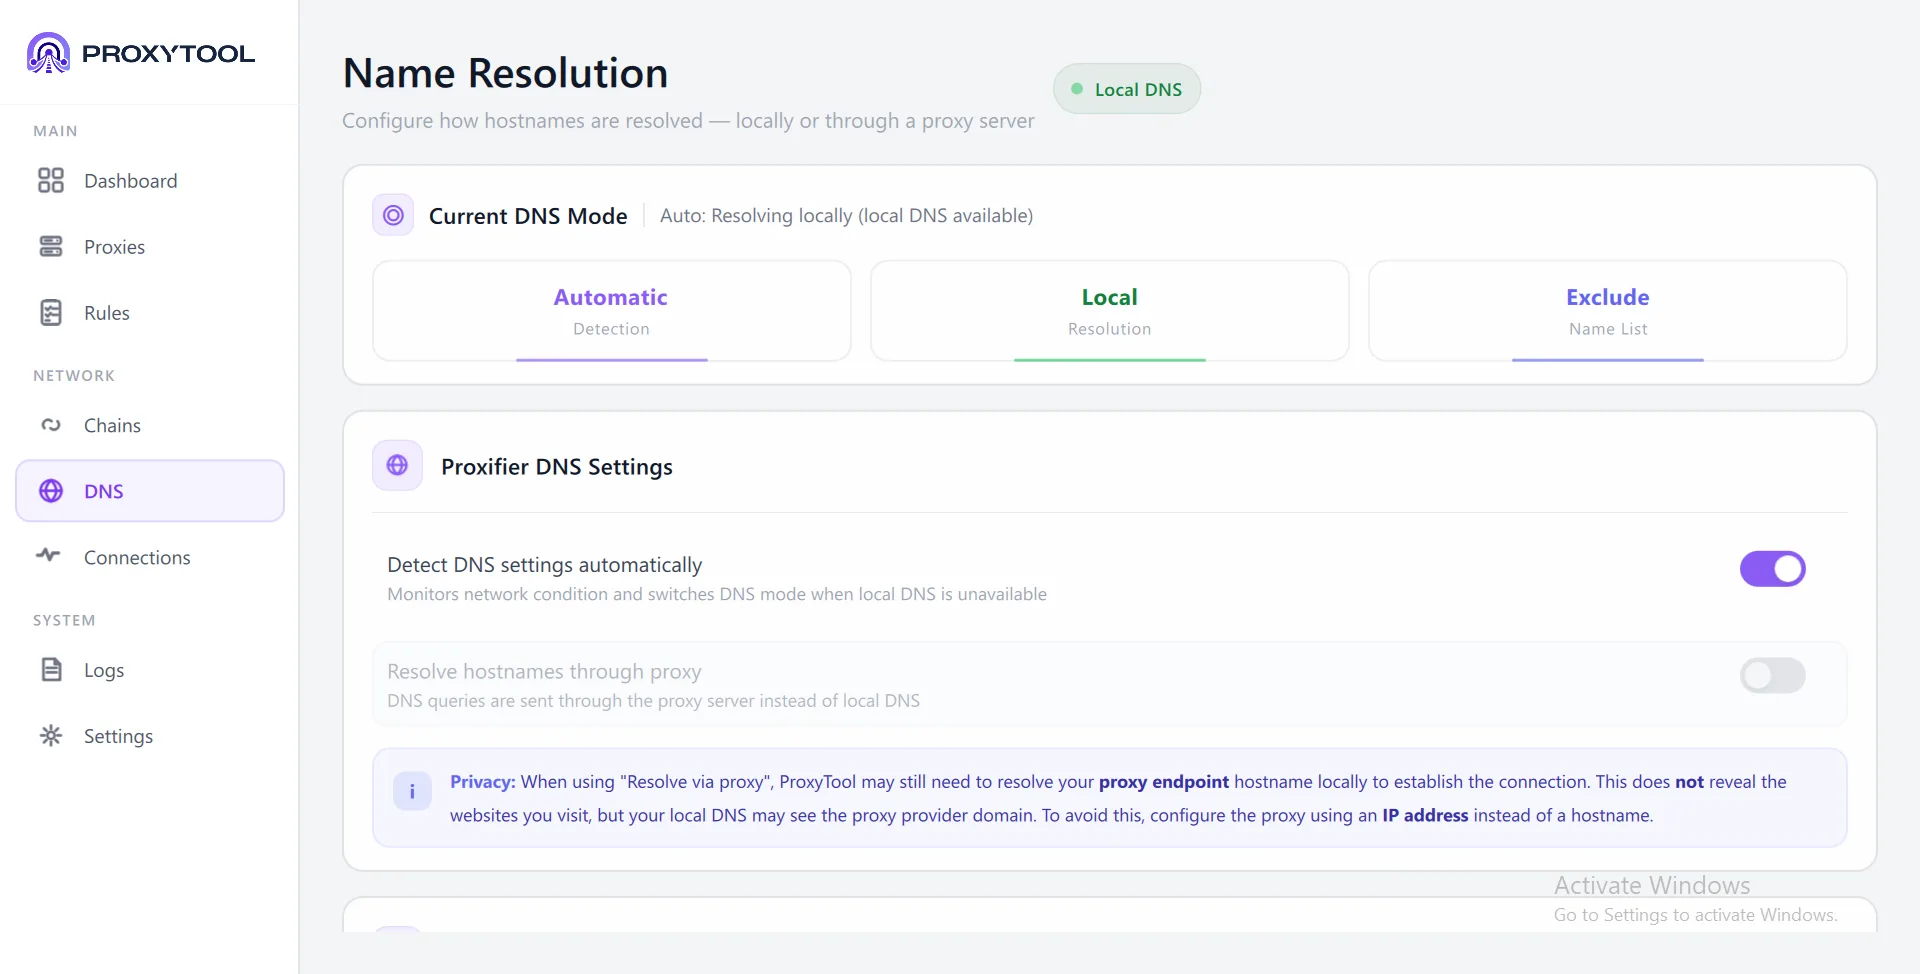
Current DNS Mode
The status badge in the top-right corner (Local DNS or Via Proxy) shows the active resolution path at a glance. Three tabs below it control the detection mode:
| Tab | How it works | Best for |
|---|---|---|
| Automatic Detection | Monitors network conditions and switches to proxy DNS automatically when local DNS is unavailable | General use — best balance of speed and privacy |
| Local Resolution | Always uses the system's own DNS resolver | Performance priority — fastest resolution |
| Exclude / Name List | Fine-tune which domains bypass proxy DNS. Supports wildcards (*, ?) and constants like %ComputerName% |
Hybrid setups where some domains must resolve locally |
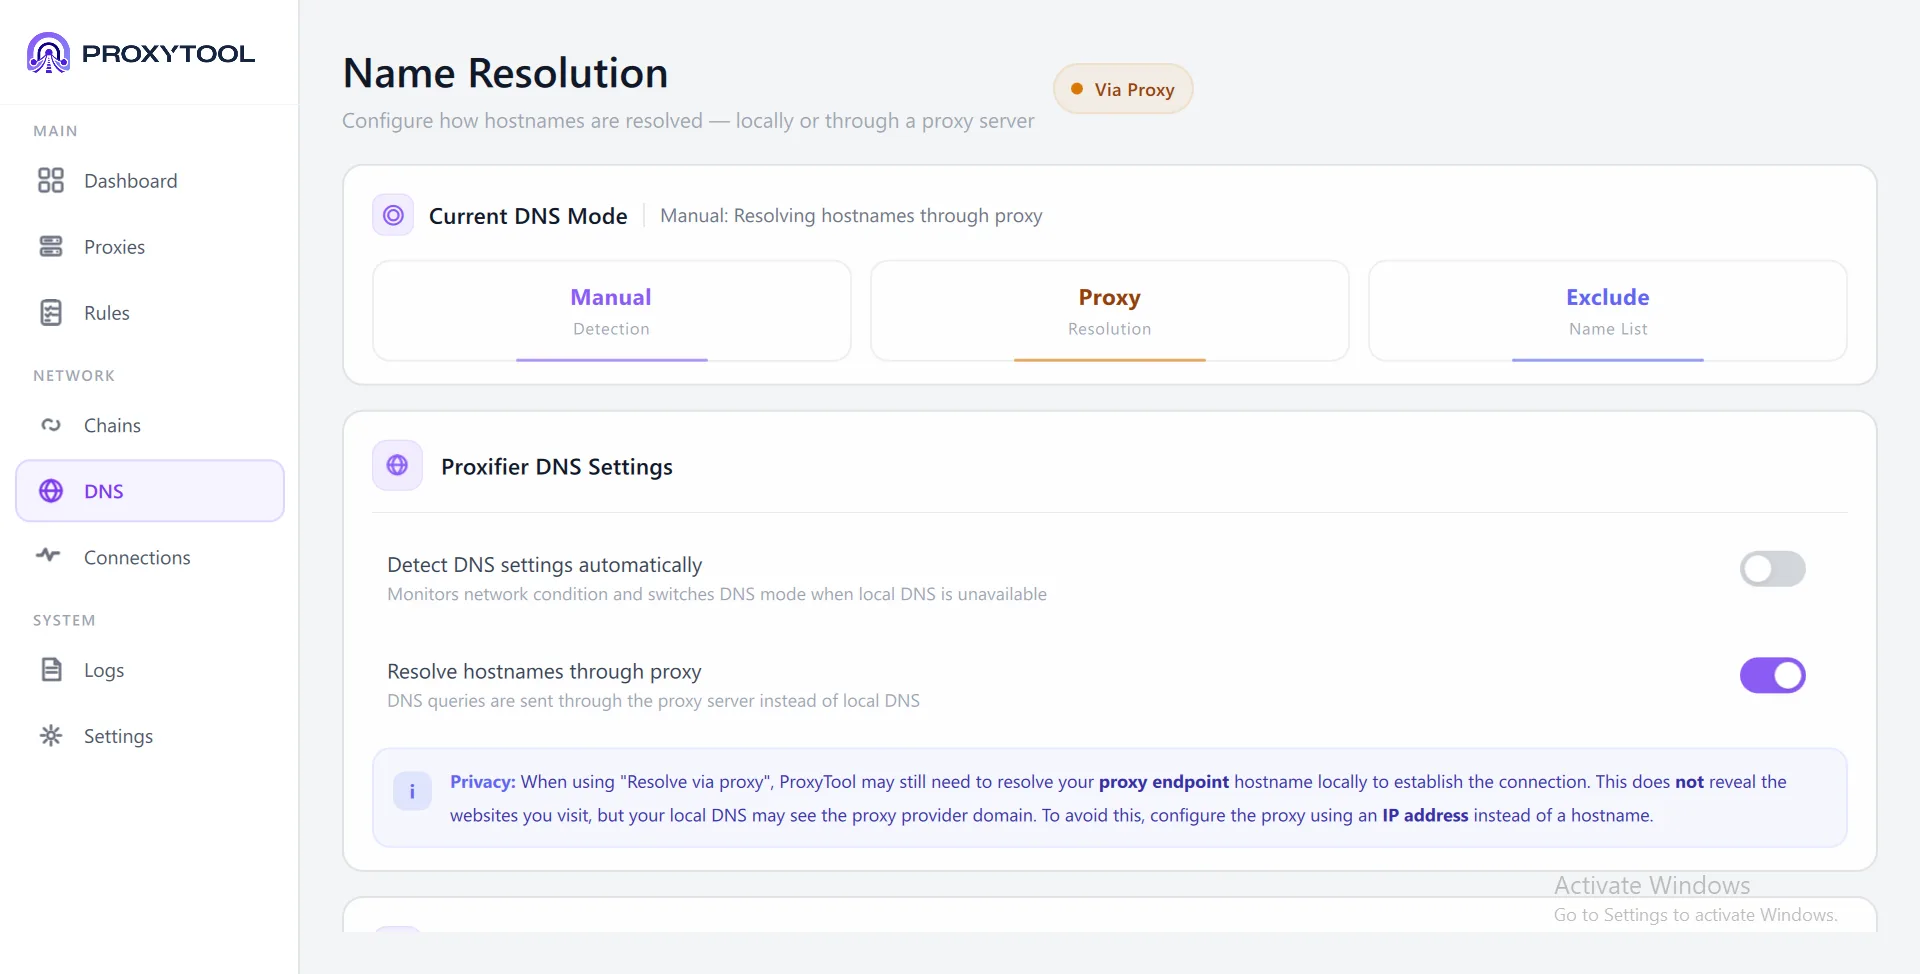
Proxifier DNS Settings
Two toggles control the connection between auto-detection and proxy resolution:
- Detect DNS settings automatically — monitors network conditions and switches DNS mode when local DNS becomes unavailable (on by default)
- Resolve hostnames through proxy — sends all DNS queries through the proxy server instead of local DNS. When enabled, the badge changes to Via Proxy and the detection tab switches to Manual / Proxy
IP Protection & Leak Prevention
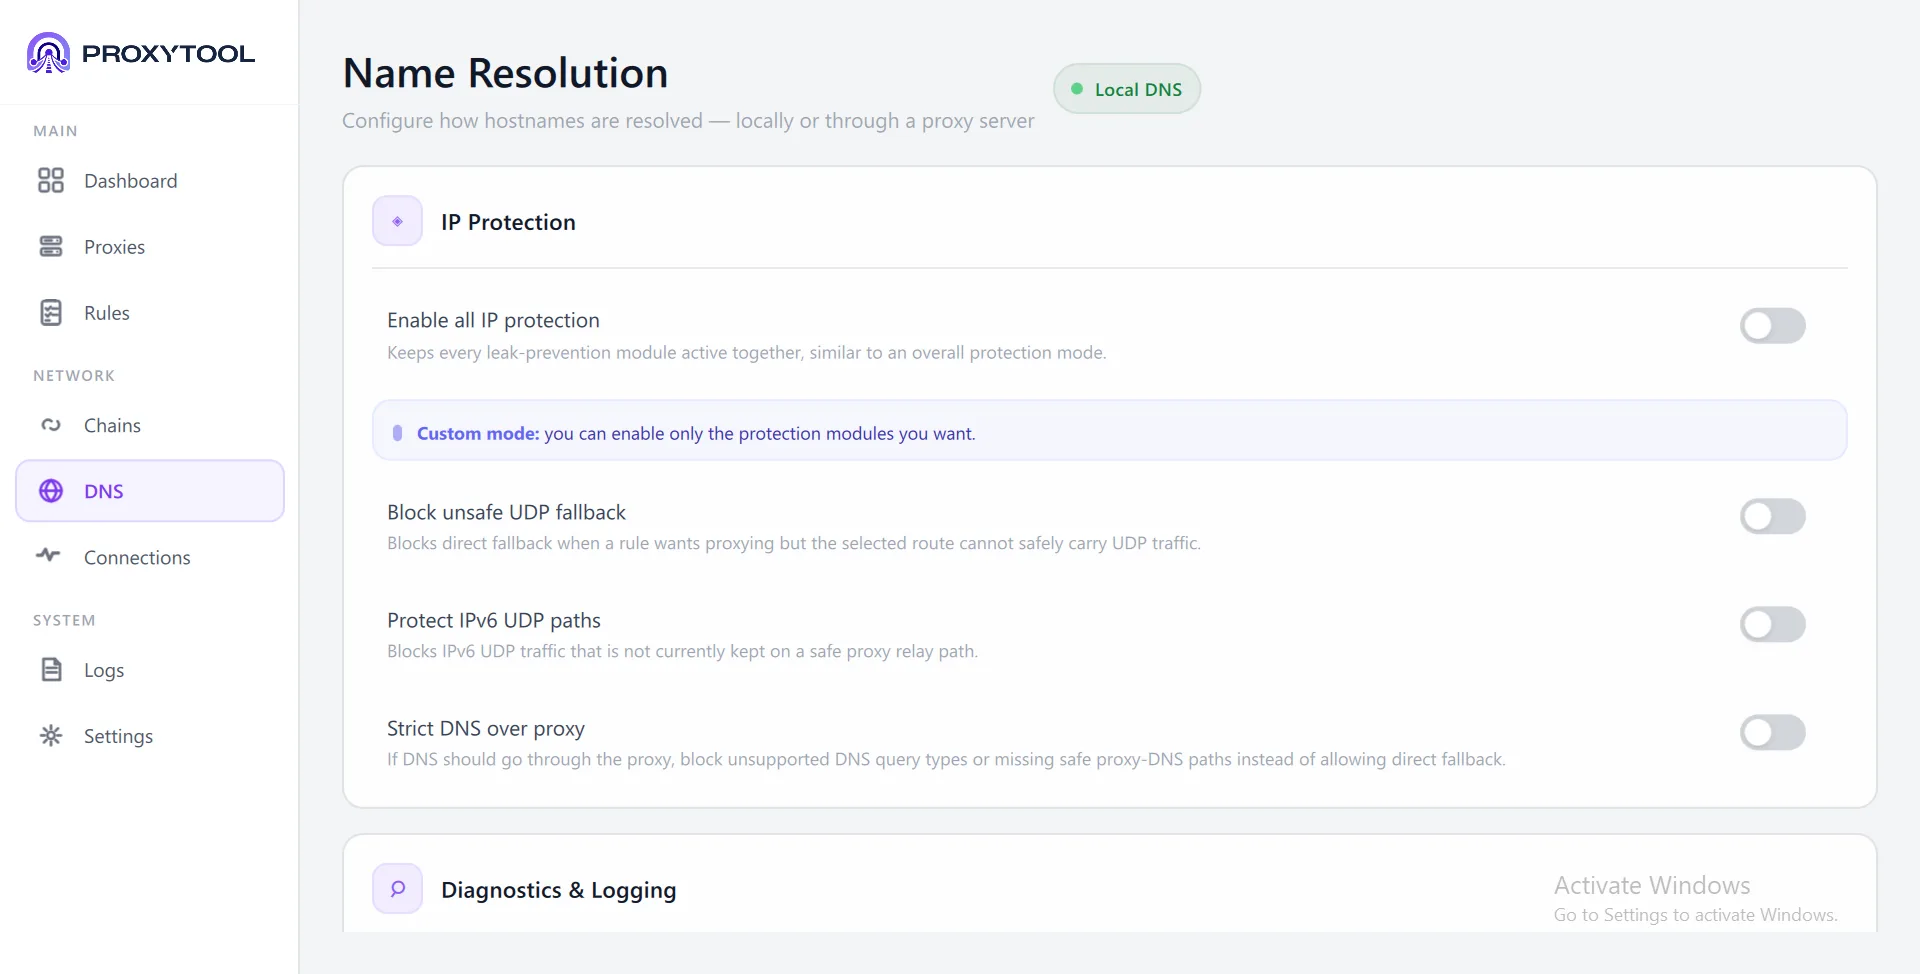
Scroll down on the DNS page to find the IP Protection panel. These settings prevent traffic from leaking outside the proxy when the operating system or applications attempt alternative network paths. You can enable everything at once or pick individual modules in custom mode.
| Option | Default | What it prevents |
|---|---|---|
| Enable all IP protection | Off | Master toggle — activates all protection modules below and locks them on |
| Block unsafe UDP fallback | Off | Blocks direct UDP connections (incl. QUIC/HTTP3 and WebRTC) when a rule requires proxying but the route cannot carry UDP |
| Protect IPv6 UDP paths | Off | Blocks IPv6 UDP traffic that is not currently kept on a safe proxy relay path |
| Strict DNS over proxy | Off | If DNS should go through the proxy, blocks unsupported query types or missing safe paths instead of allowing direct fallback |
Windows may send DNS queries across all available network interfaces simultaneously (Smart Multi-Homed Name Resolution), which can bypass proxy DNS even when "Resolve via proxy" is enabled.
When IP Protection or Strict DNS is active, ProxyTool warns about this and provides registry commands to disable it:
DisableSmartNameResolution = 1 and DisableParallelAandAAAA = 1
Additionally, disable browser Secure DNS (DoH) to prevent browsers from resolving names independently.
Traffic Monitor
The Traffic Monitor page is your real-time command center for network visibility. Two tabs at the top — Analytics and Connections — let you switch between high-level insights and a detailed connection table. Use Freeze to pause all counters for analysis, or Clear to reset session data.
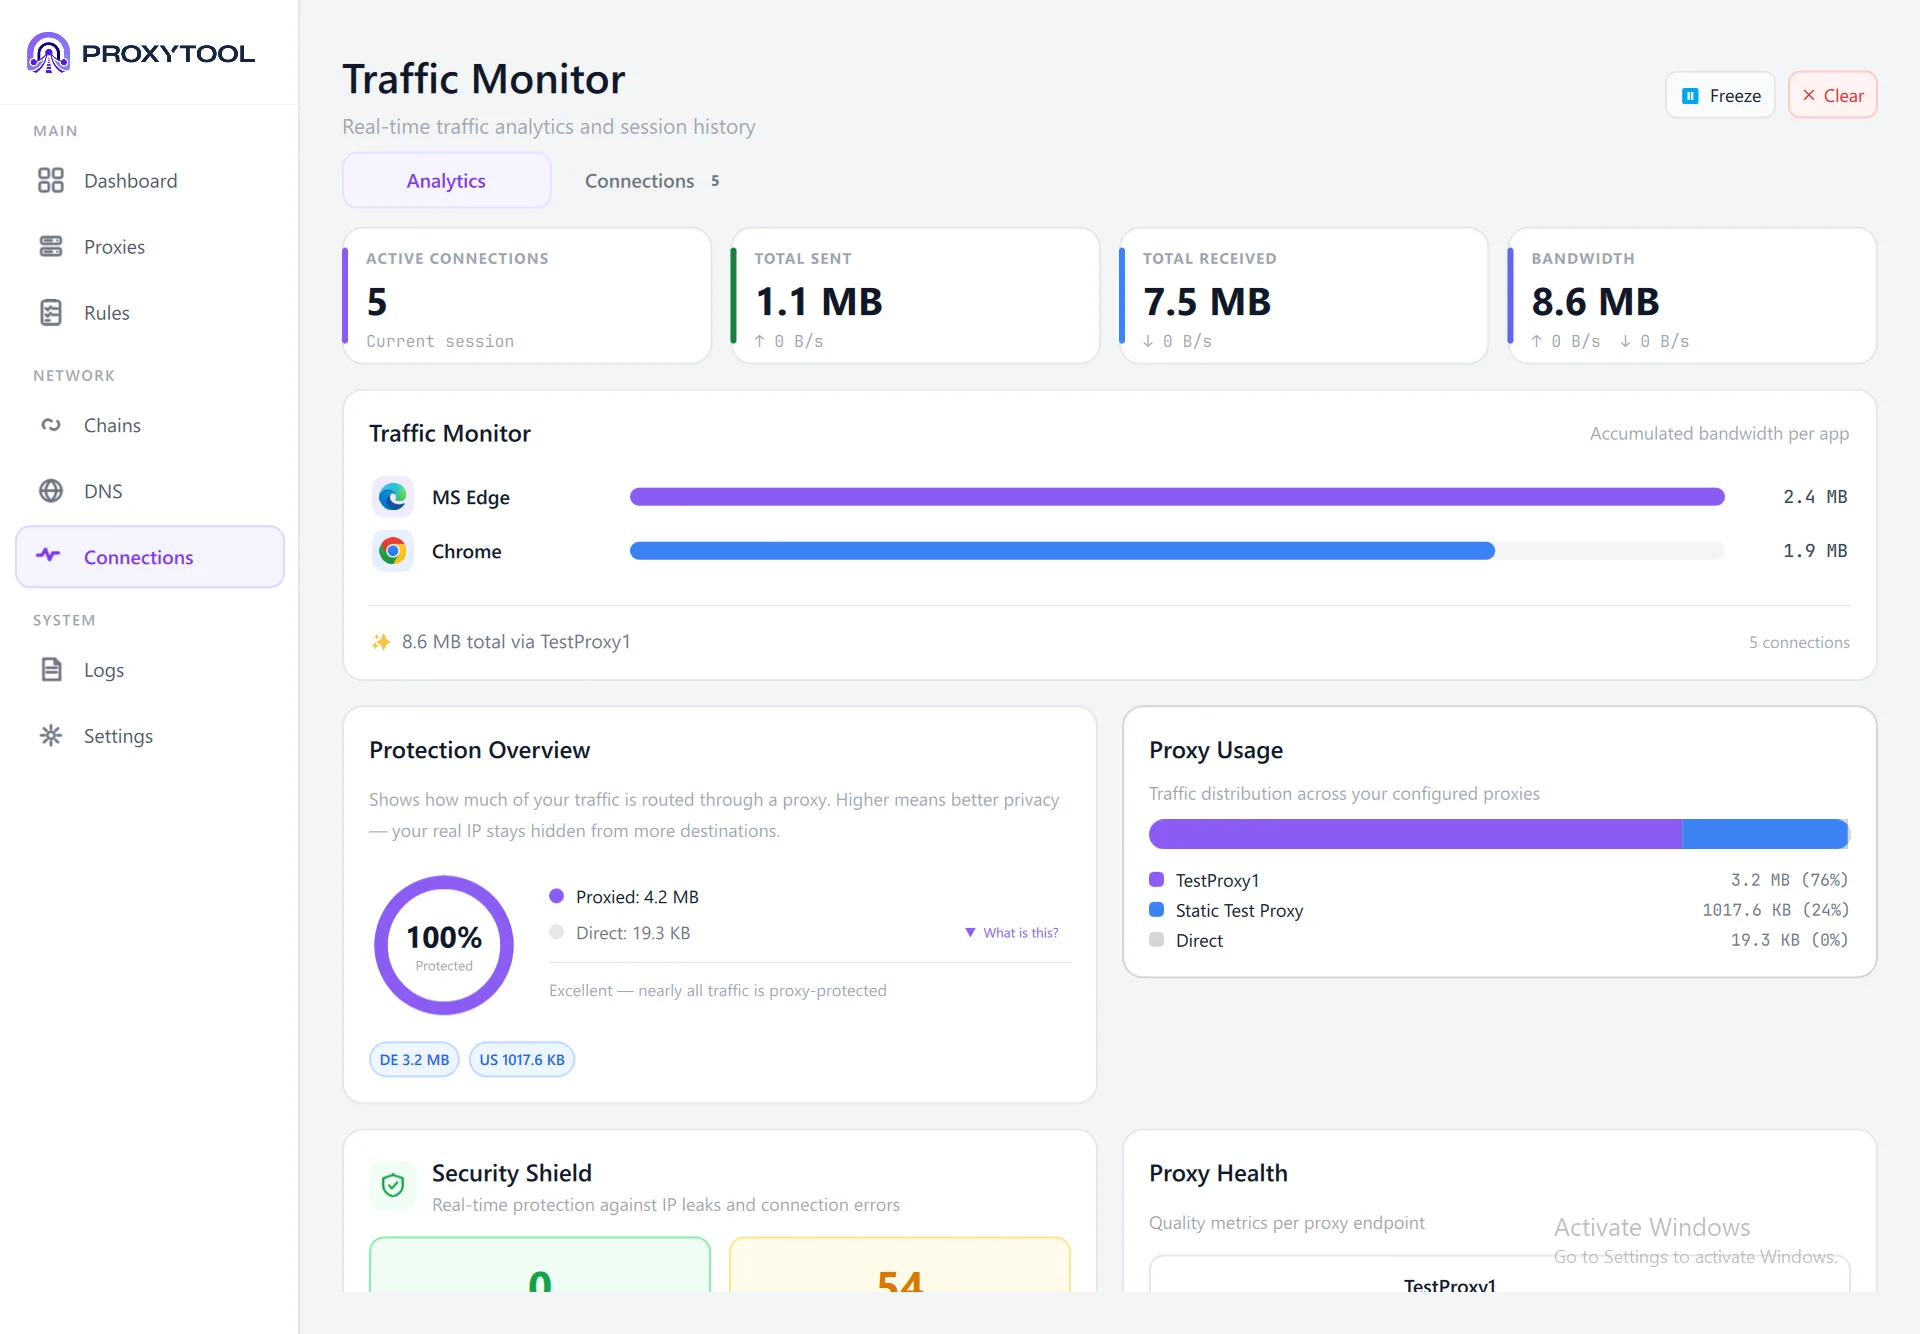

Summary Cards
Four cards at the top provide session-level metrics at a glance:
Analytics Tab
The Analytics tab organizes traffic data into several cards that scroll vertically:
| Card | What it shows |
|---|---|
| Traffic Monitor | Per-app bandwidth bars (e.g. Chrome 1.9 MB, MS Edge 2.4 MB) with total and primary proxy name |
| Protection Overview | Ring chart showing proxied vs. direct ratio (e.g. 100% Protected), geo-badges (DE, US), and a privacy assessment |
| Proxy Usage | Stacked bar with traffic distribution across proxies (e.g. TestProxy1 76%, Static Test Proxy 24%, Direct 0%) |
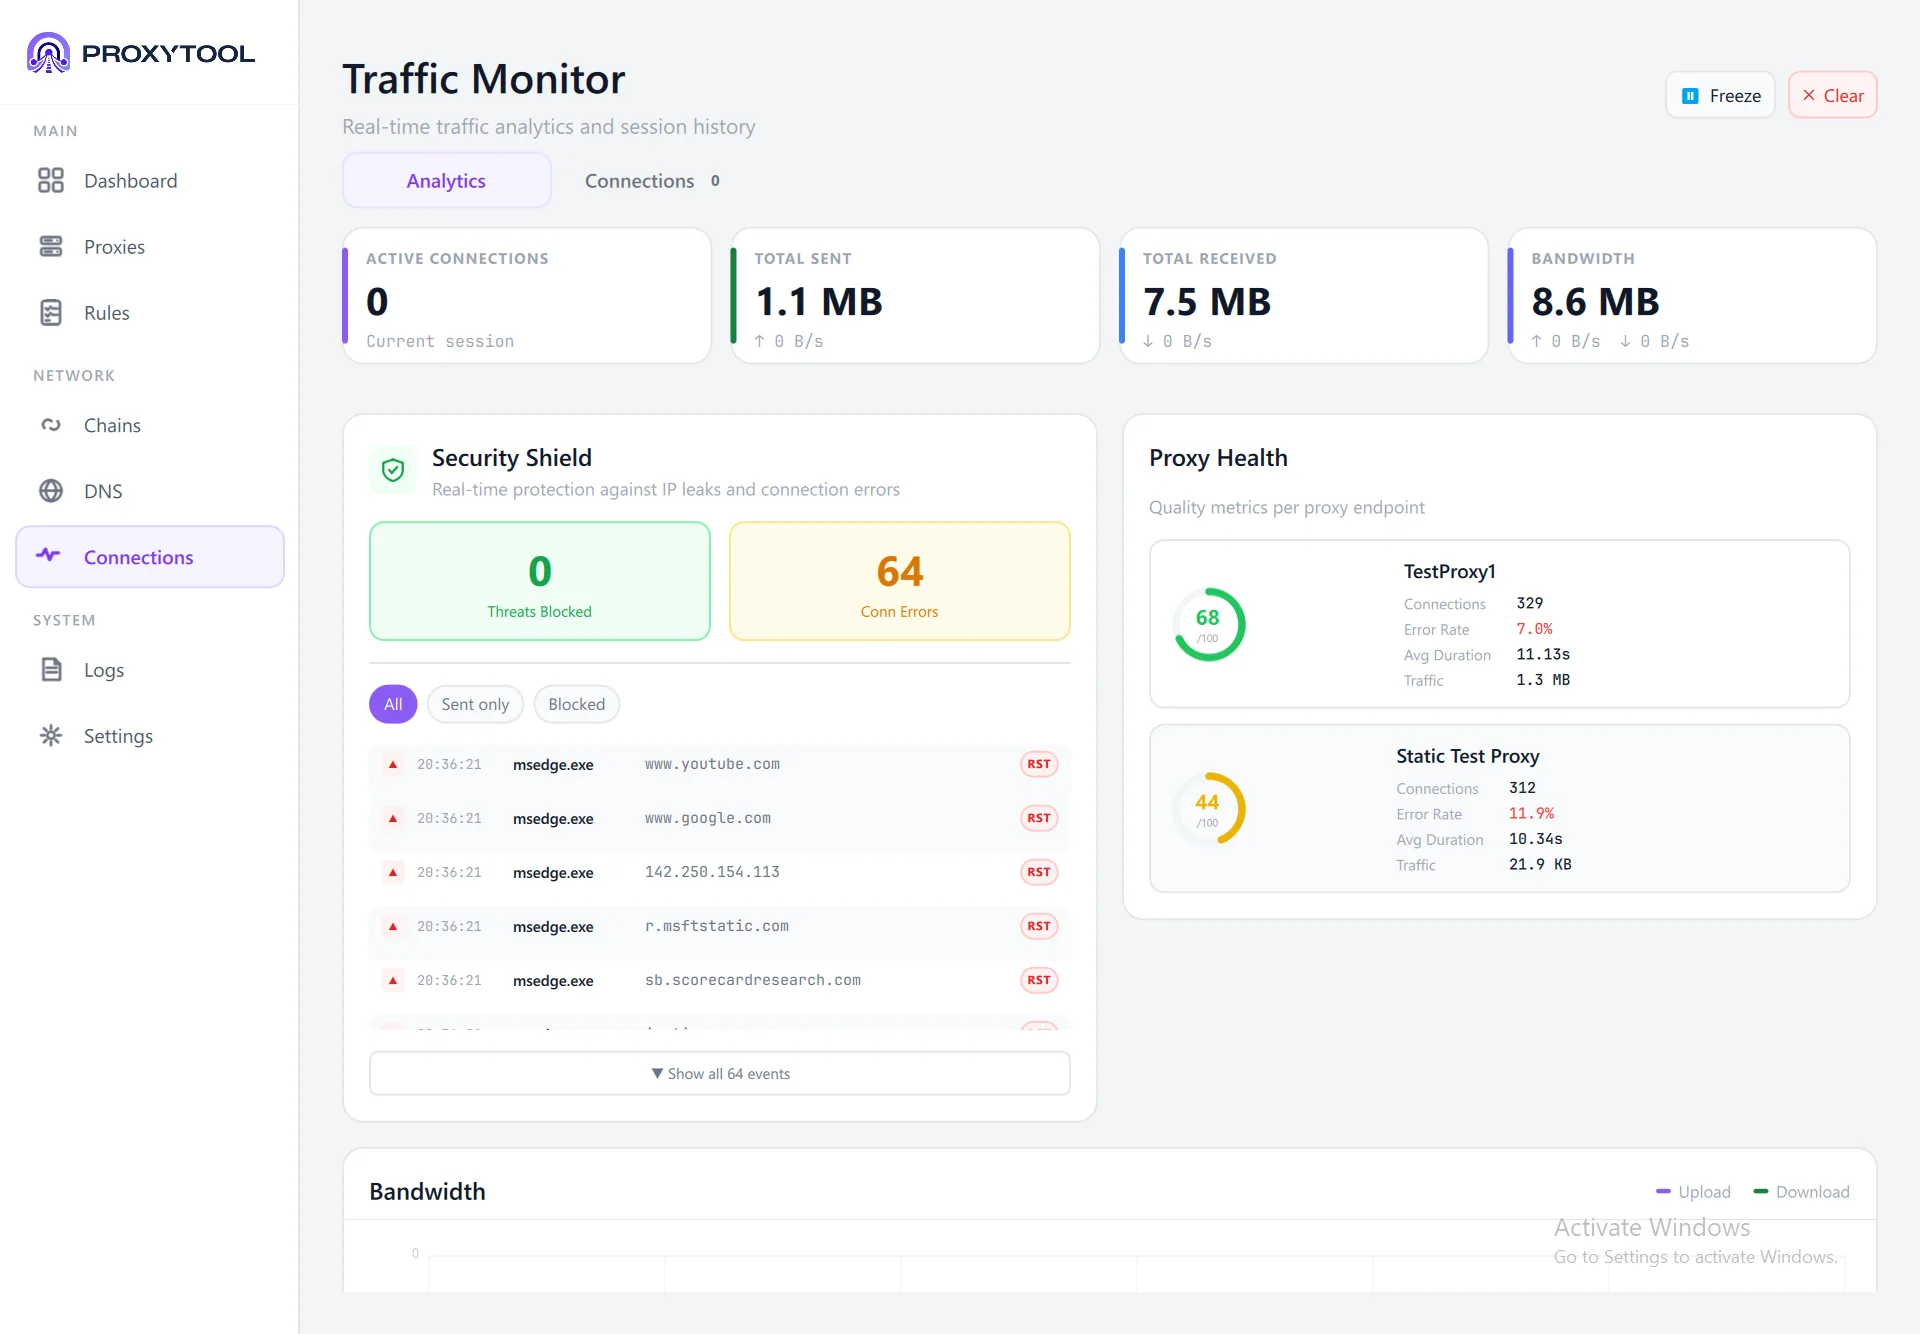
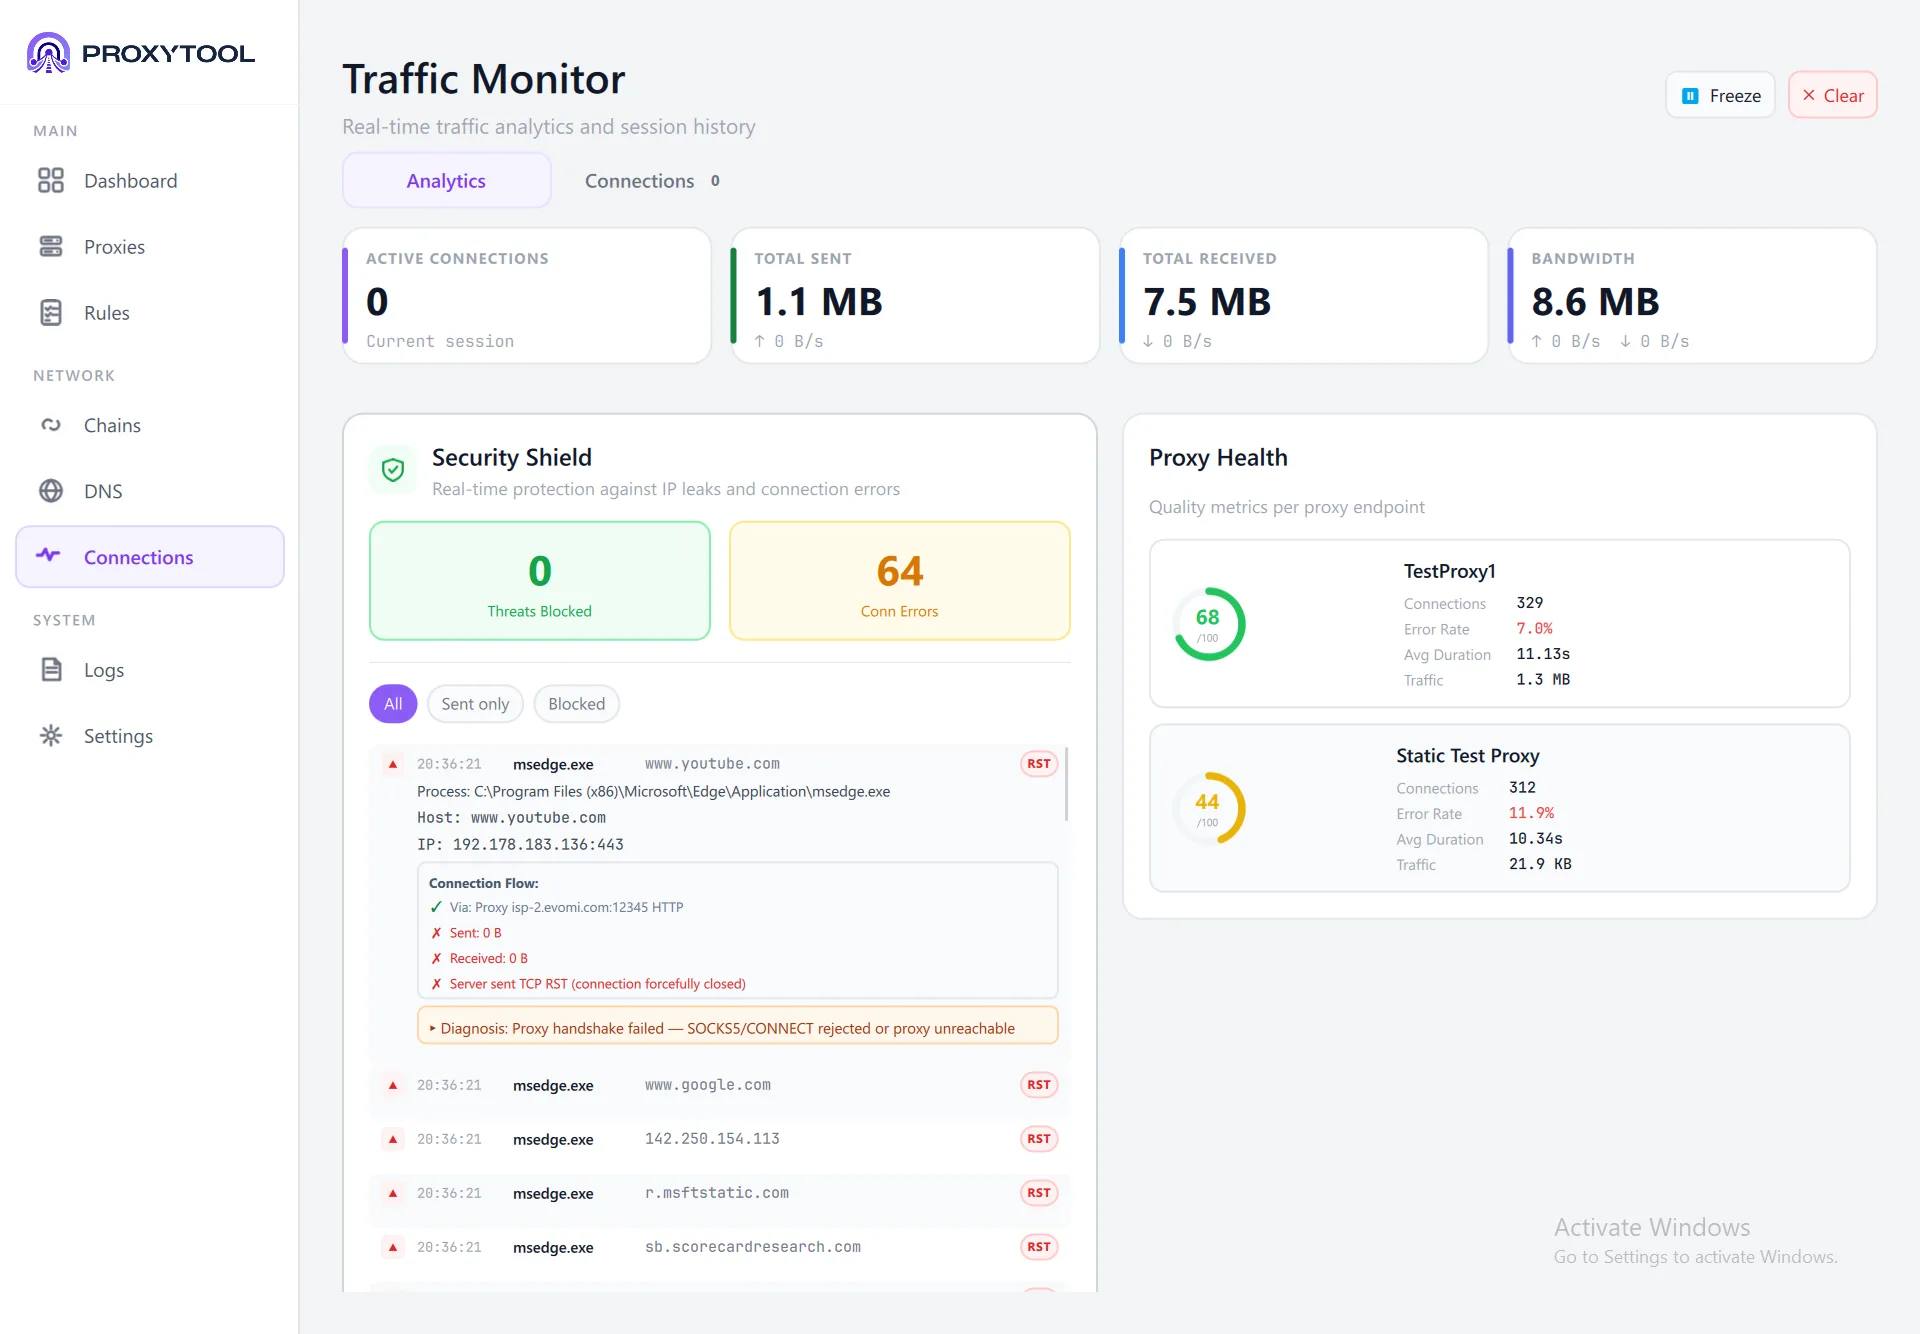
| Security Shield | Threats Blocked + Conn Errors counters. Click any event to expand Connection Flow details: process path, host, IP, proxy route, bytes sent/received, and a diagnosis (e.g. "Proxy handshake failed") |
| Proxy Health | Per-proxy quality score ring (0–100), connection count, error rate, average duration, and traffic volume |
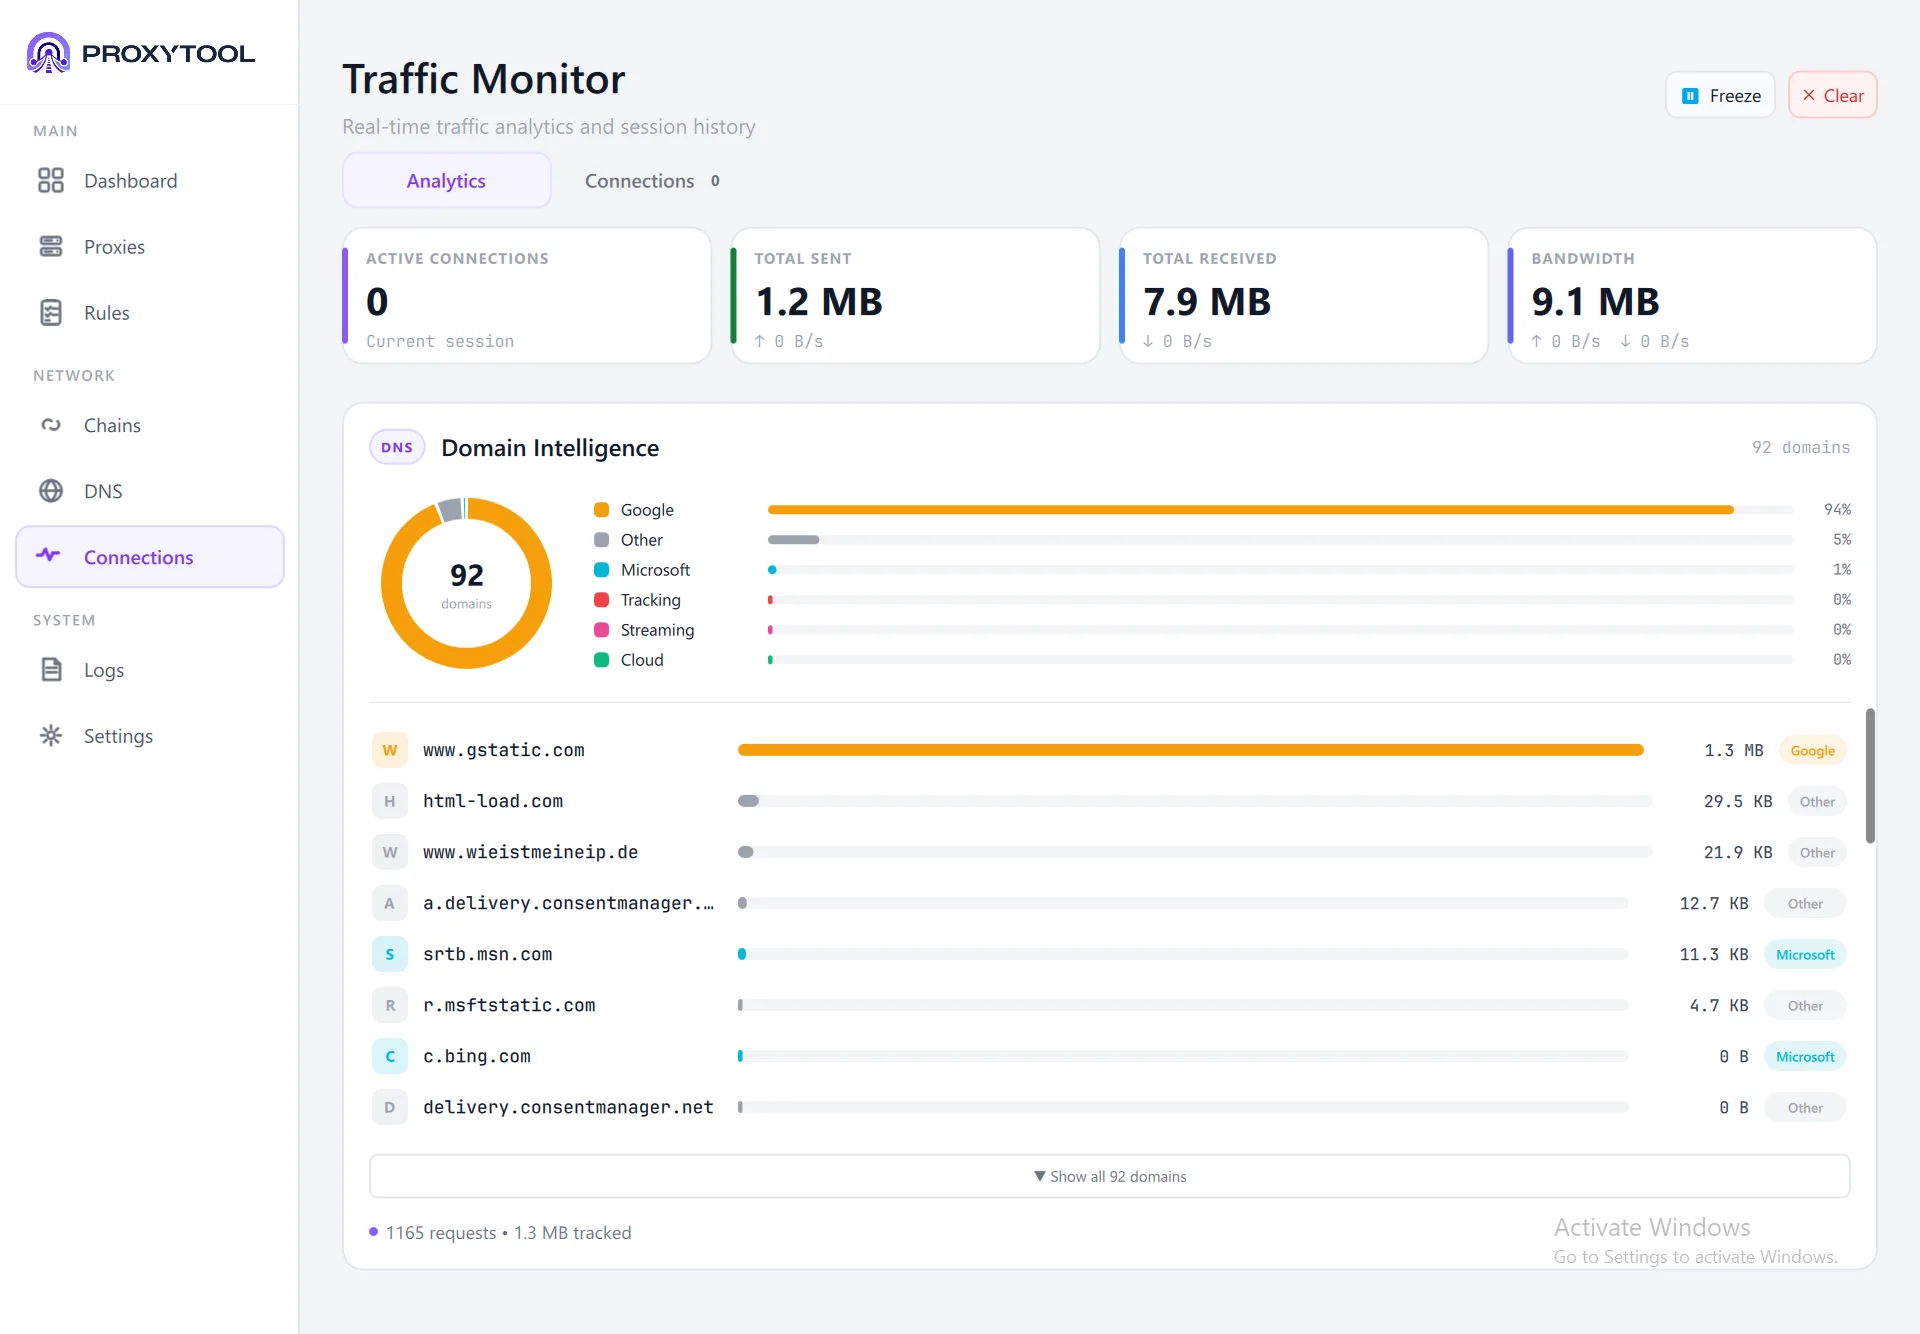
| Domain Intelligence | DNS-based category ring (Google, Microsoft, Tracking, Streaming, Cloud, Other) with per-domain breakdown showing request count and traffic percentage |
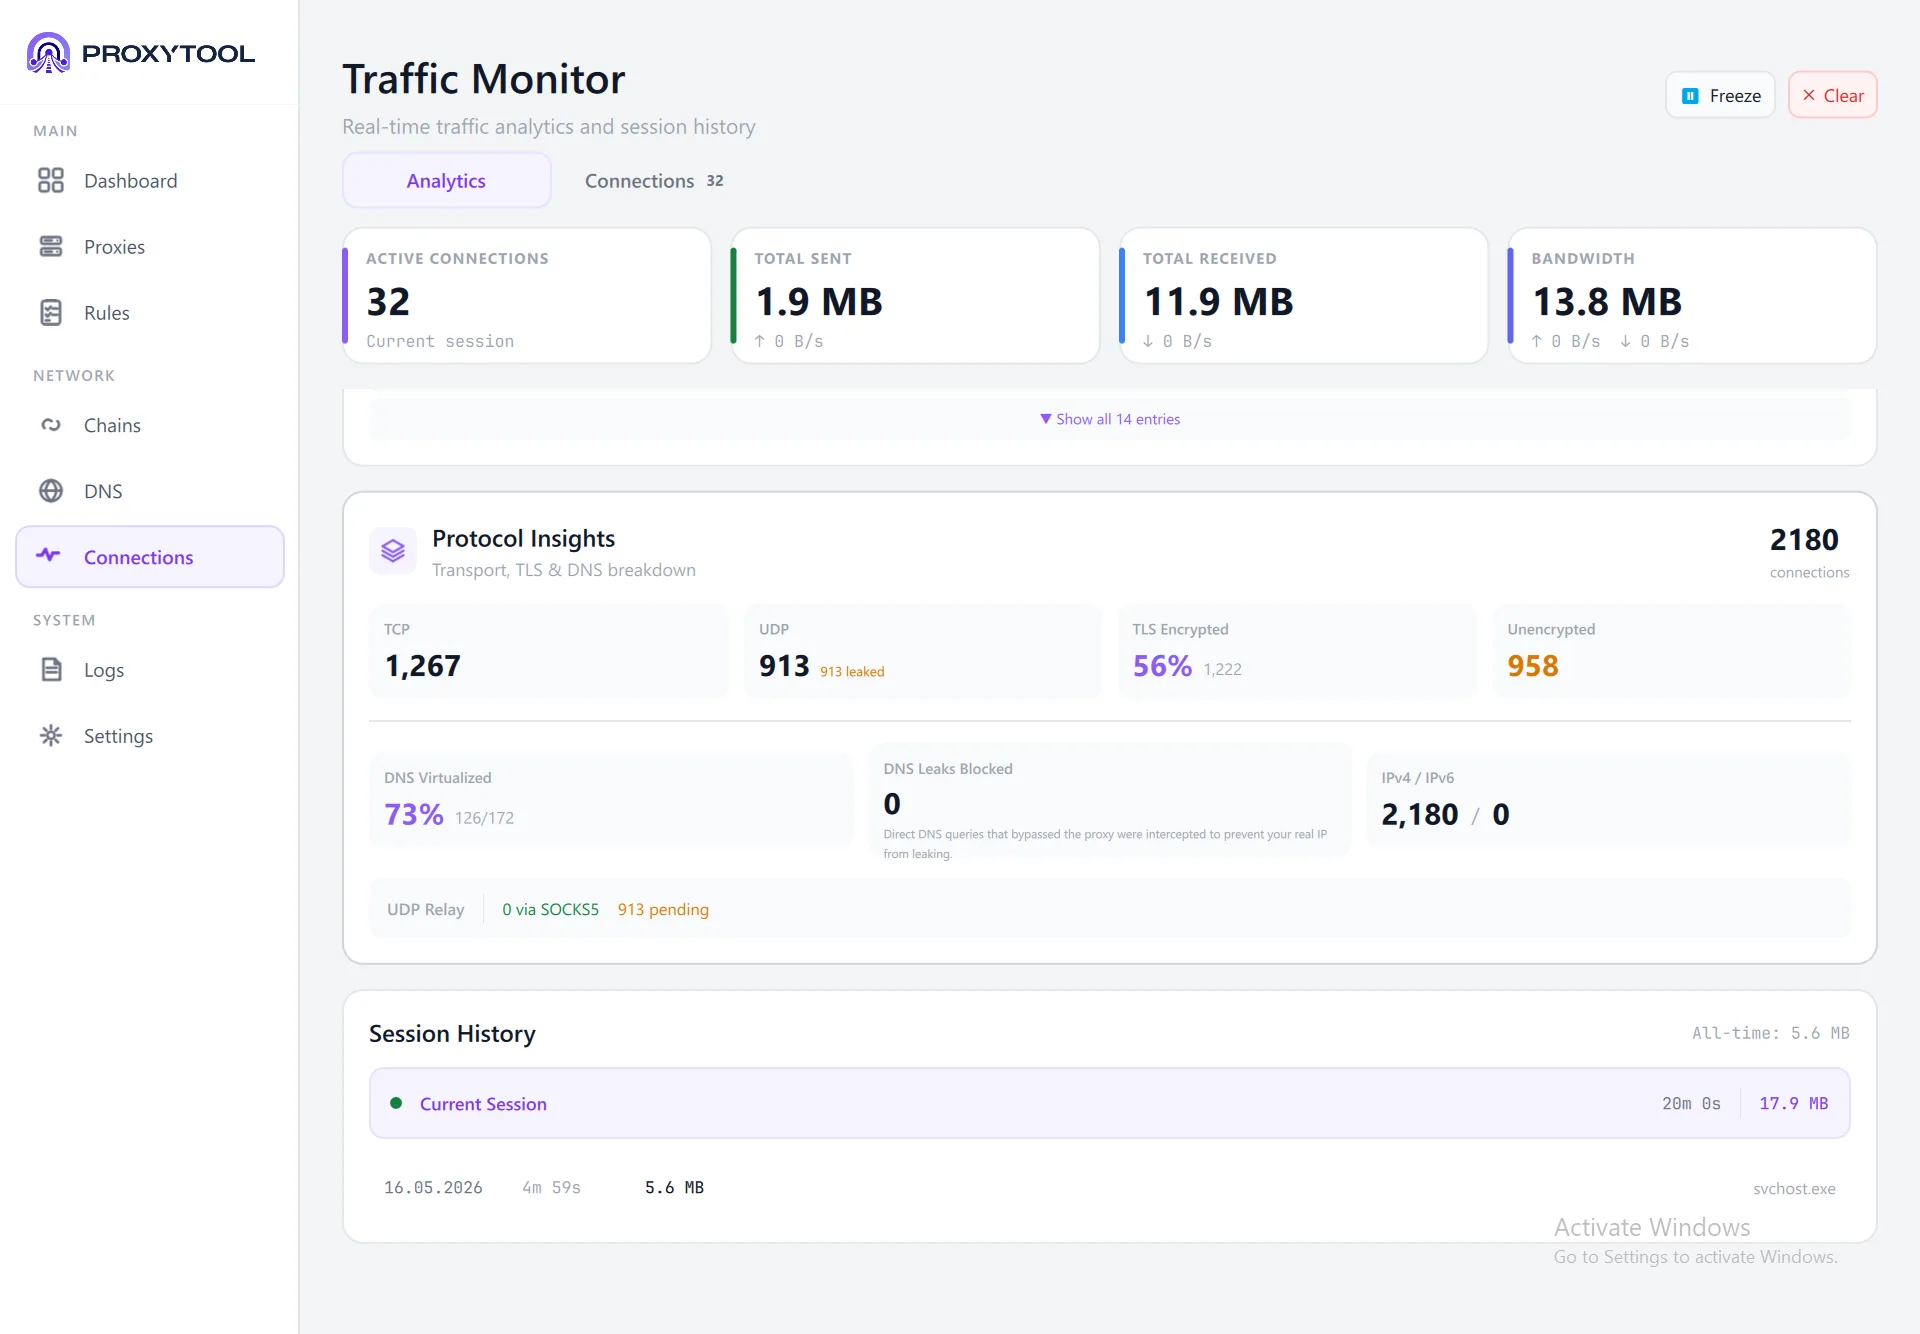
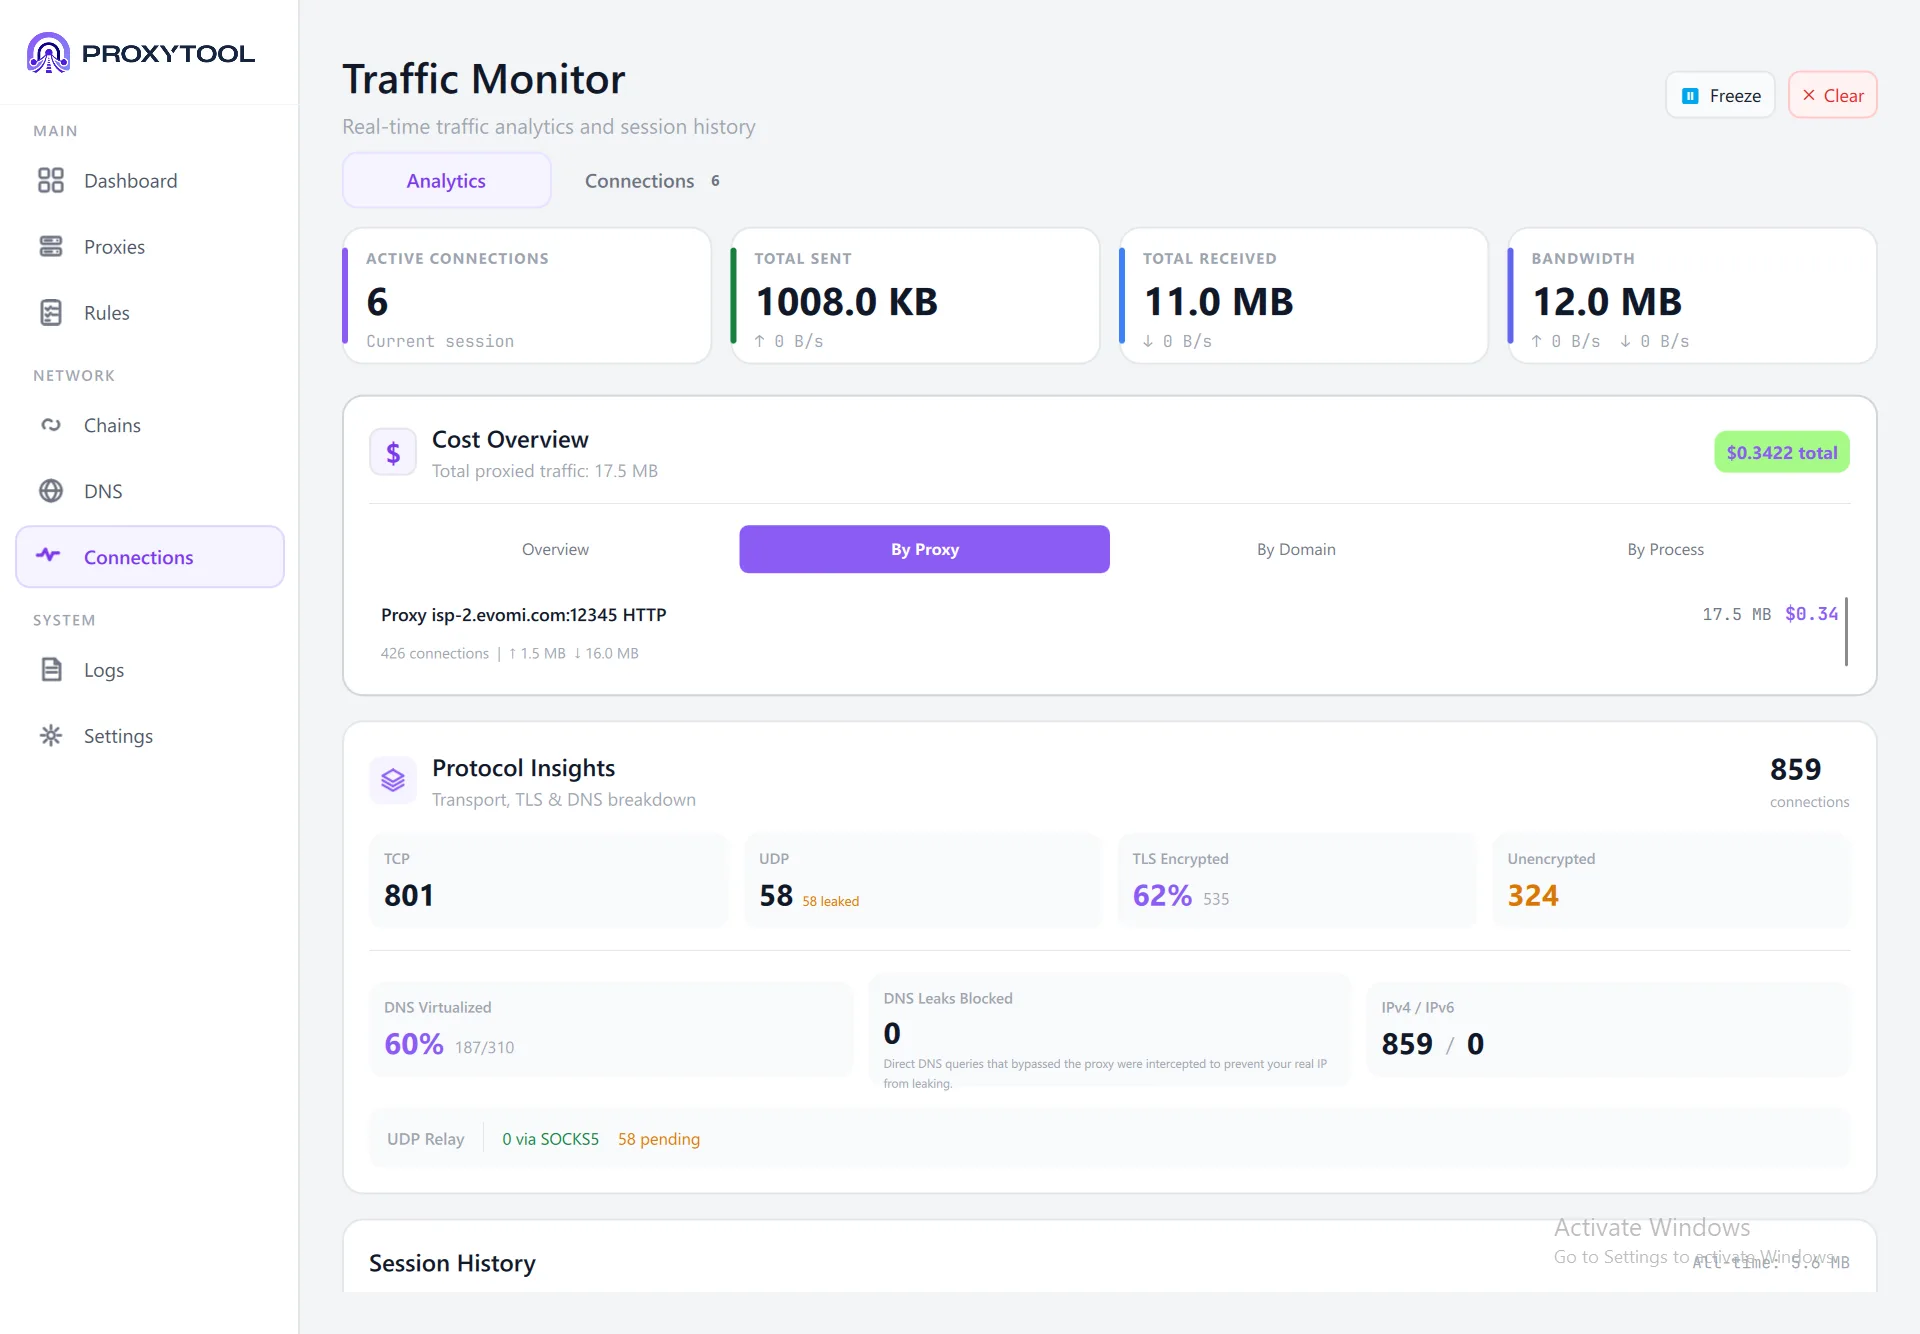
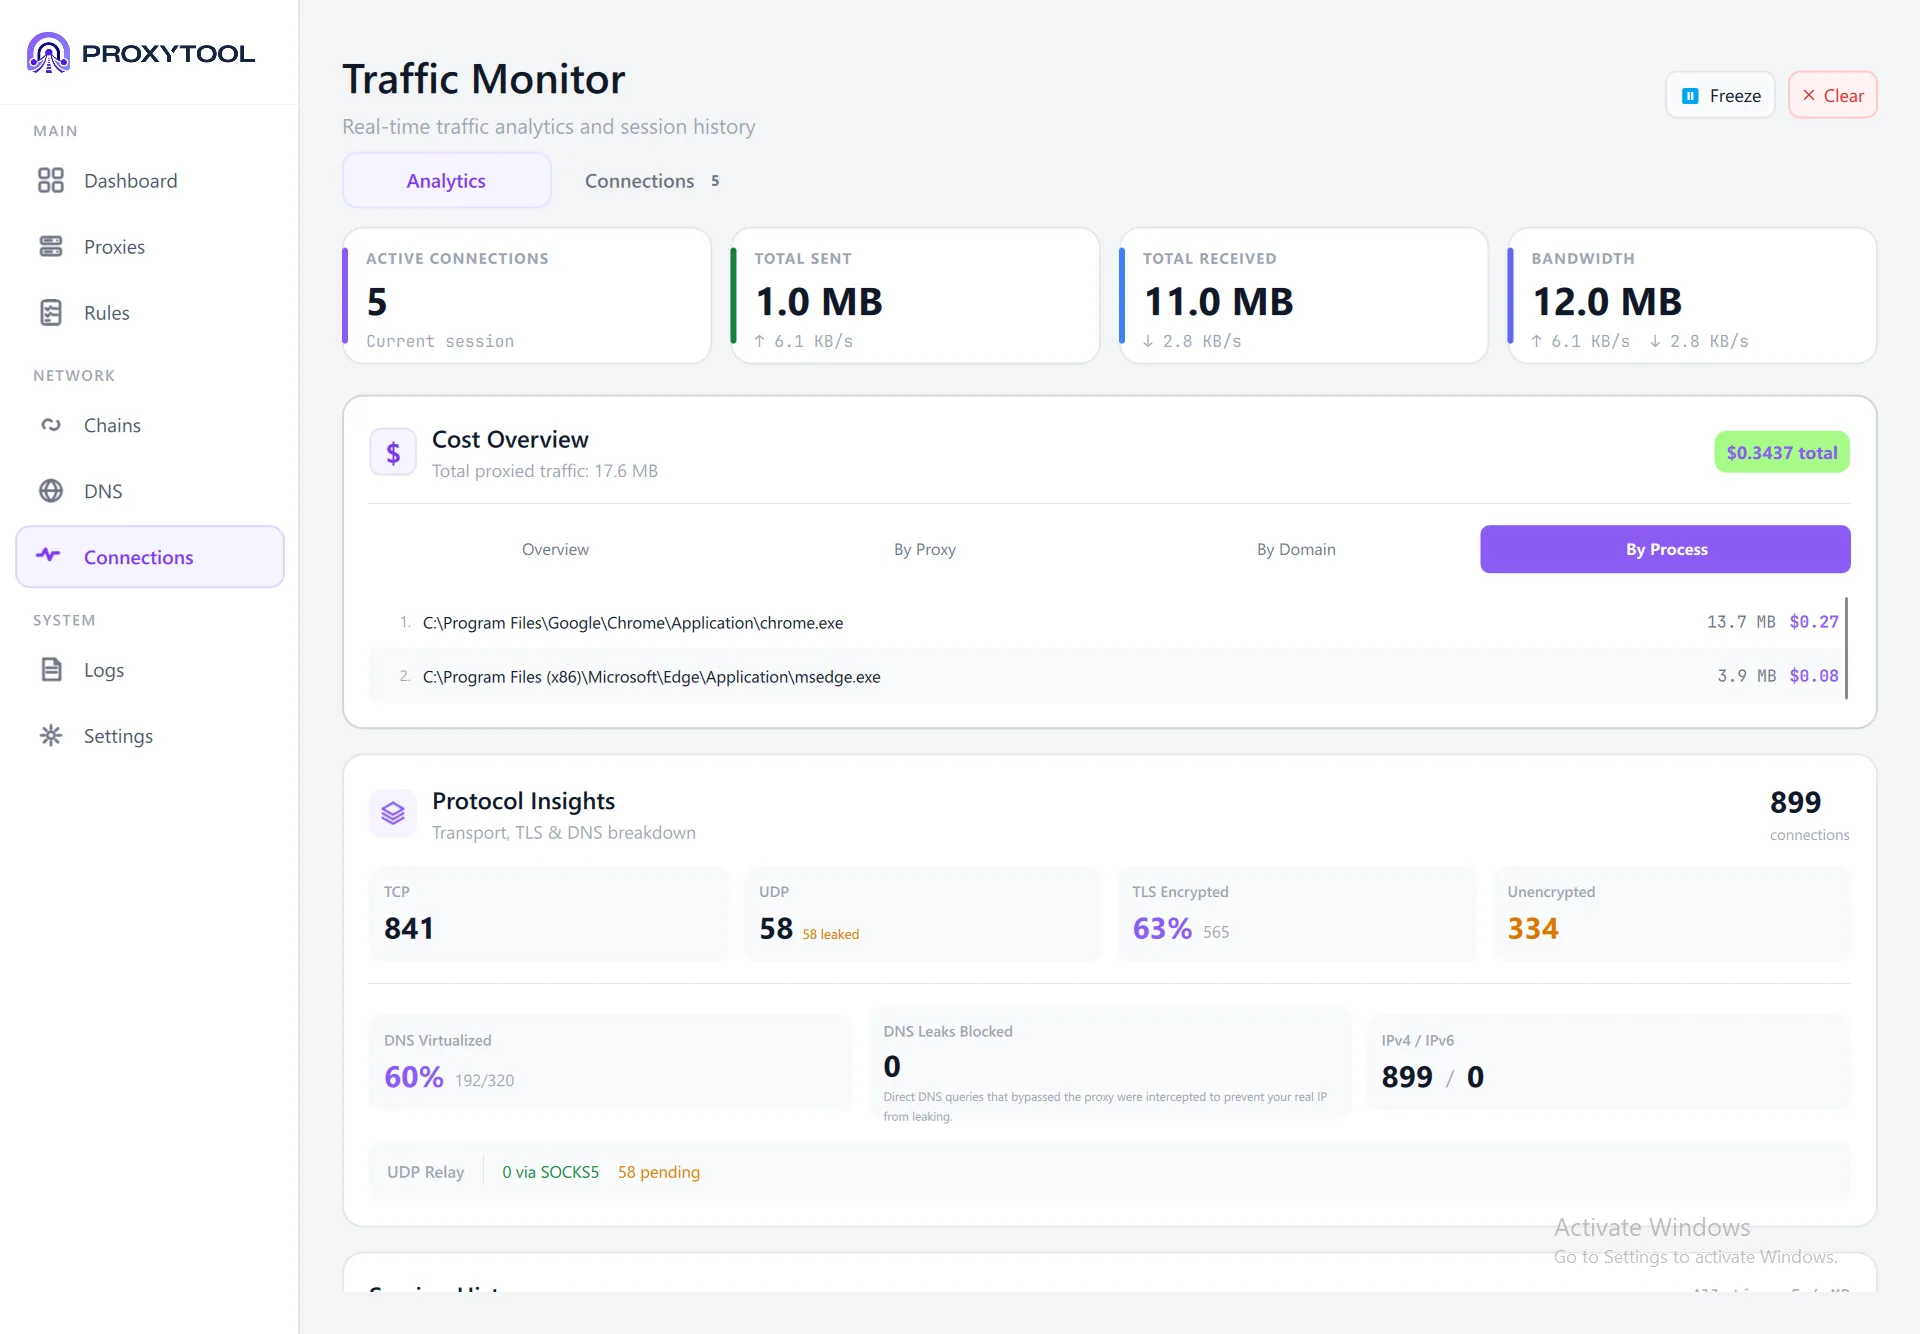
| Protocol Insights | TCP/UDP split, TLS encryption ratio, DNS virtualization percentage, DNS leaks blocked, IPv4/IPv6 balance, UDP relay status, and session history |
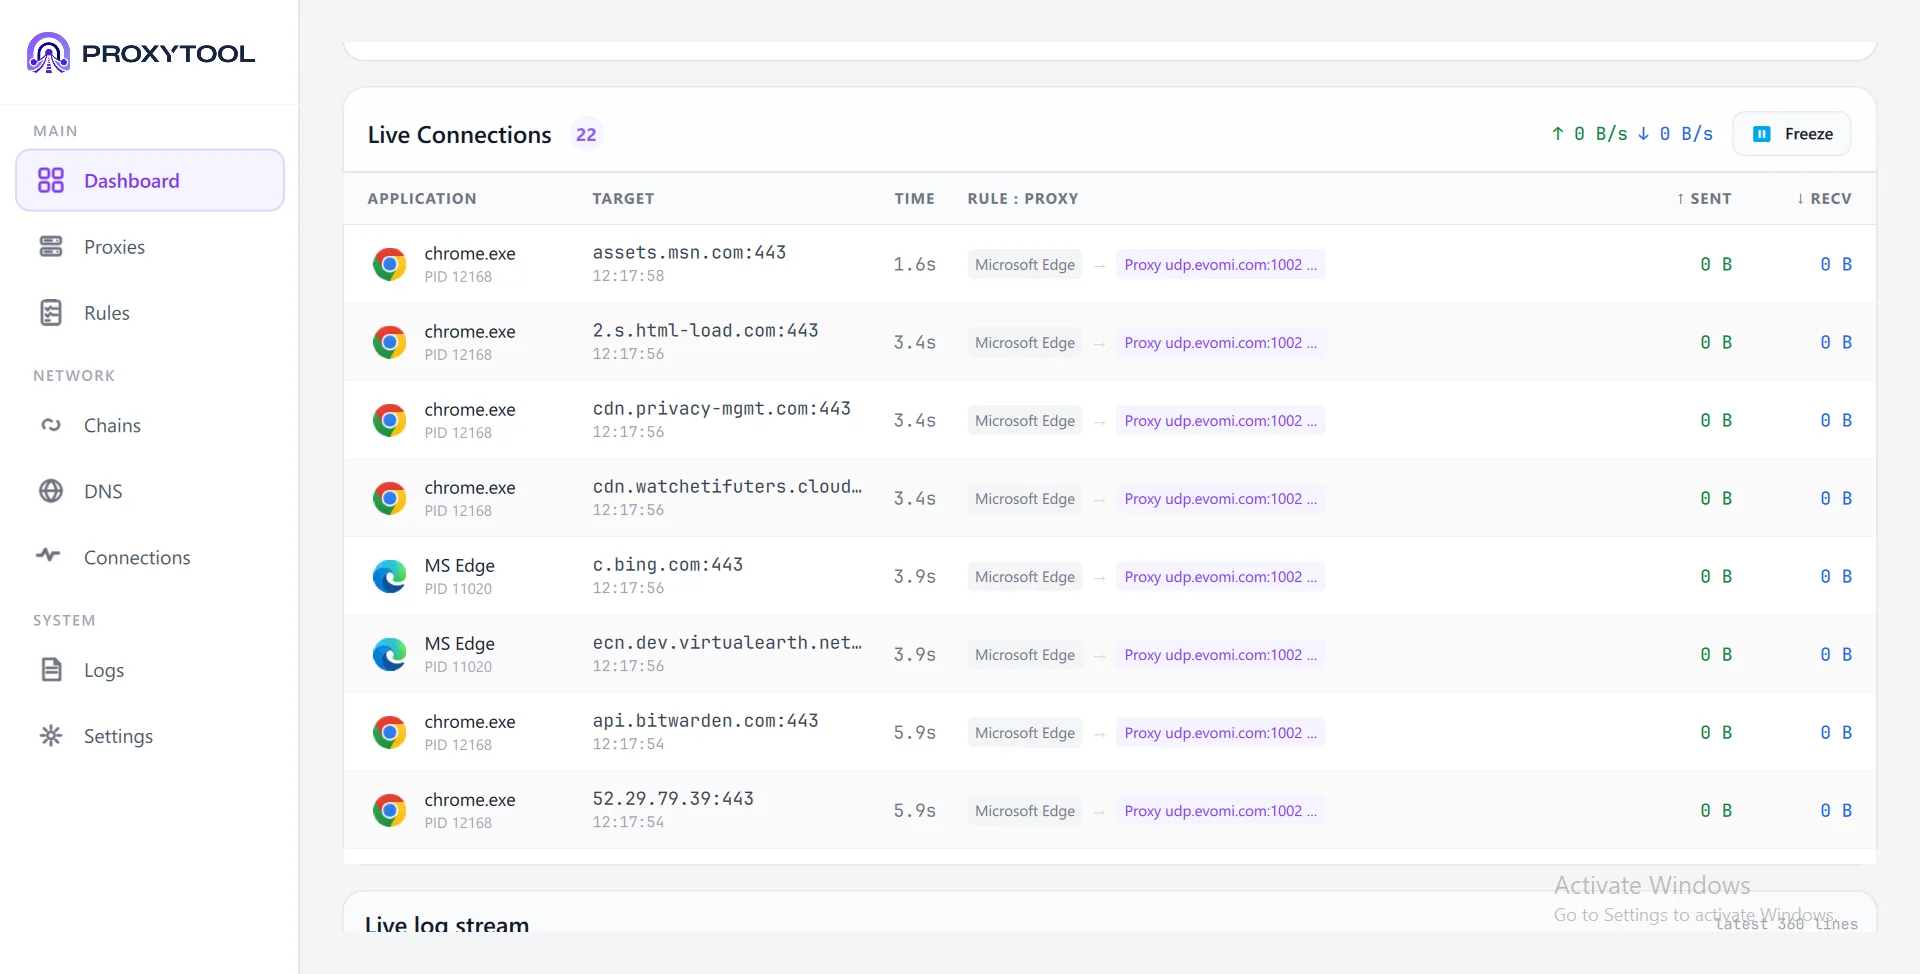
Connections Tab
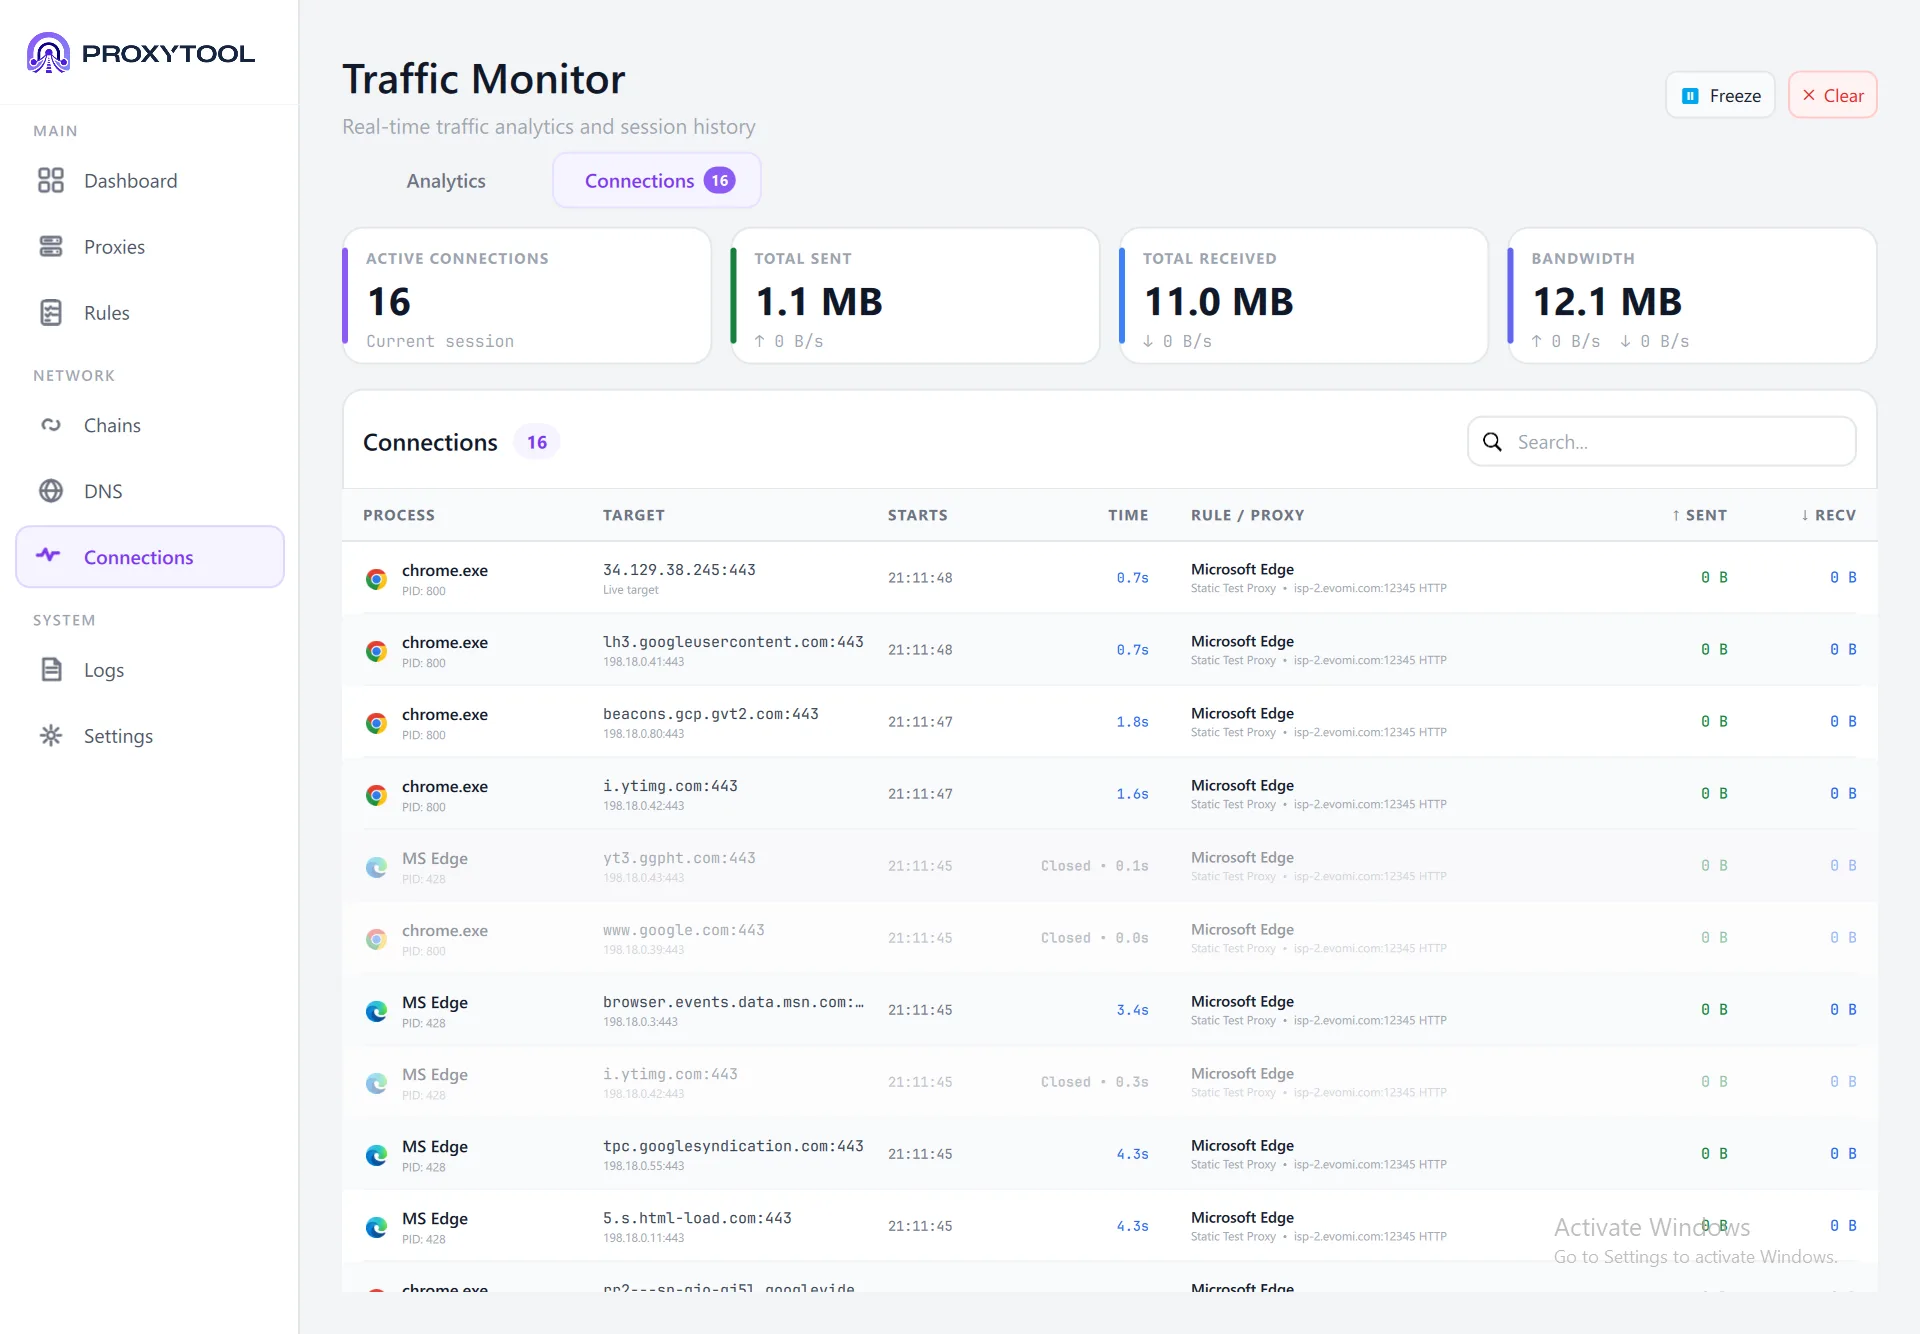
The Connections tab shows a live table of every active and recent connection:
| Column | Shows |
|---|---|
| Process | Application name + PID (e.g. chrome.exe PID: 800) |
| Target | Hostname and resolved IP with port |
| Starts | Connection start time |
| Time | Connection duration (or "Closed" for finished connections) |
| Rule / Proxy | Which rule matched and the full proxy route (e.g. "Static Test Proxy • isp-2.evomi.com:12345 HTTP") |
| Sent / Recv | Bytes transferred in each direction |
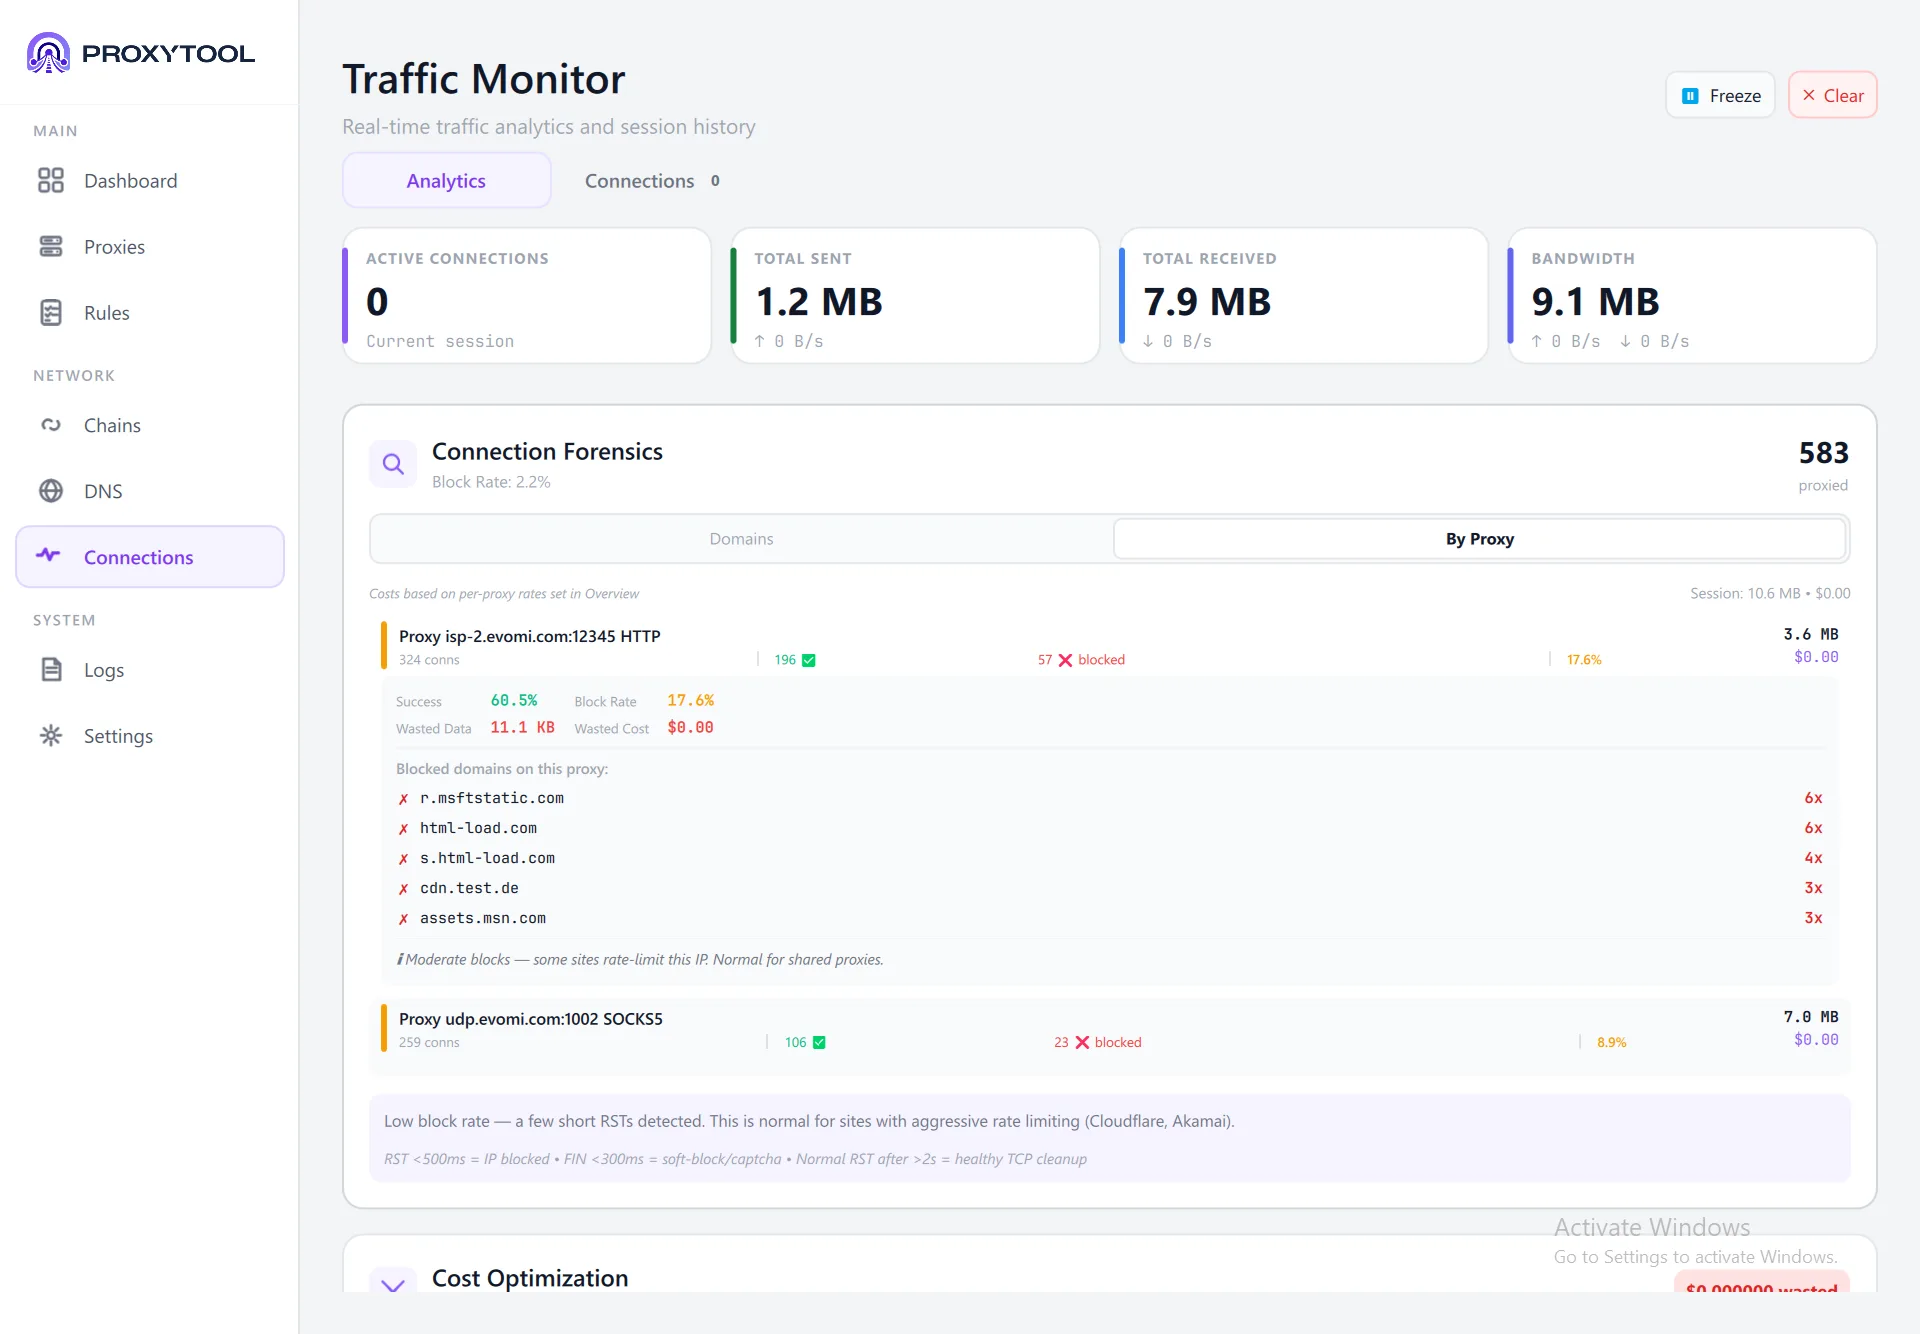
Connection Forensics
Scroll down in the Connections tab to find Connection Forensics. Two sub-tabs — Domains and By Proxy — provide deep analysis:
- Domains — Shows all contacted domains with request count and traffic percentage. The overall block rate is displayed in the header
- By Proxy — Expand each proxy to see success rate, block rate, wasted data, and blocked domains with frequency
Cost Overview
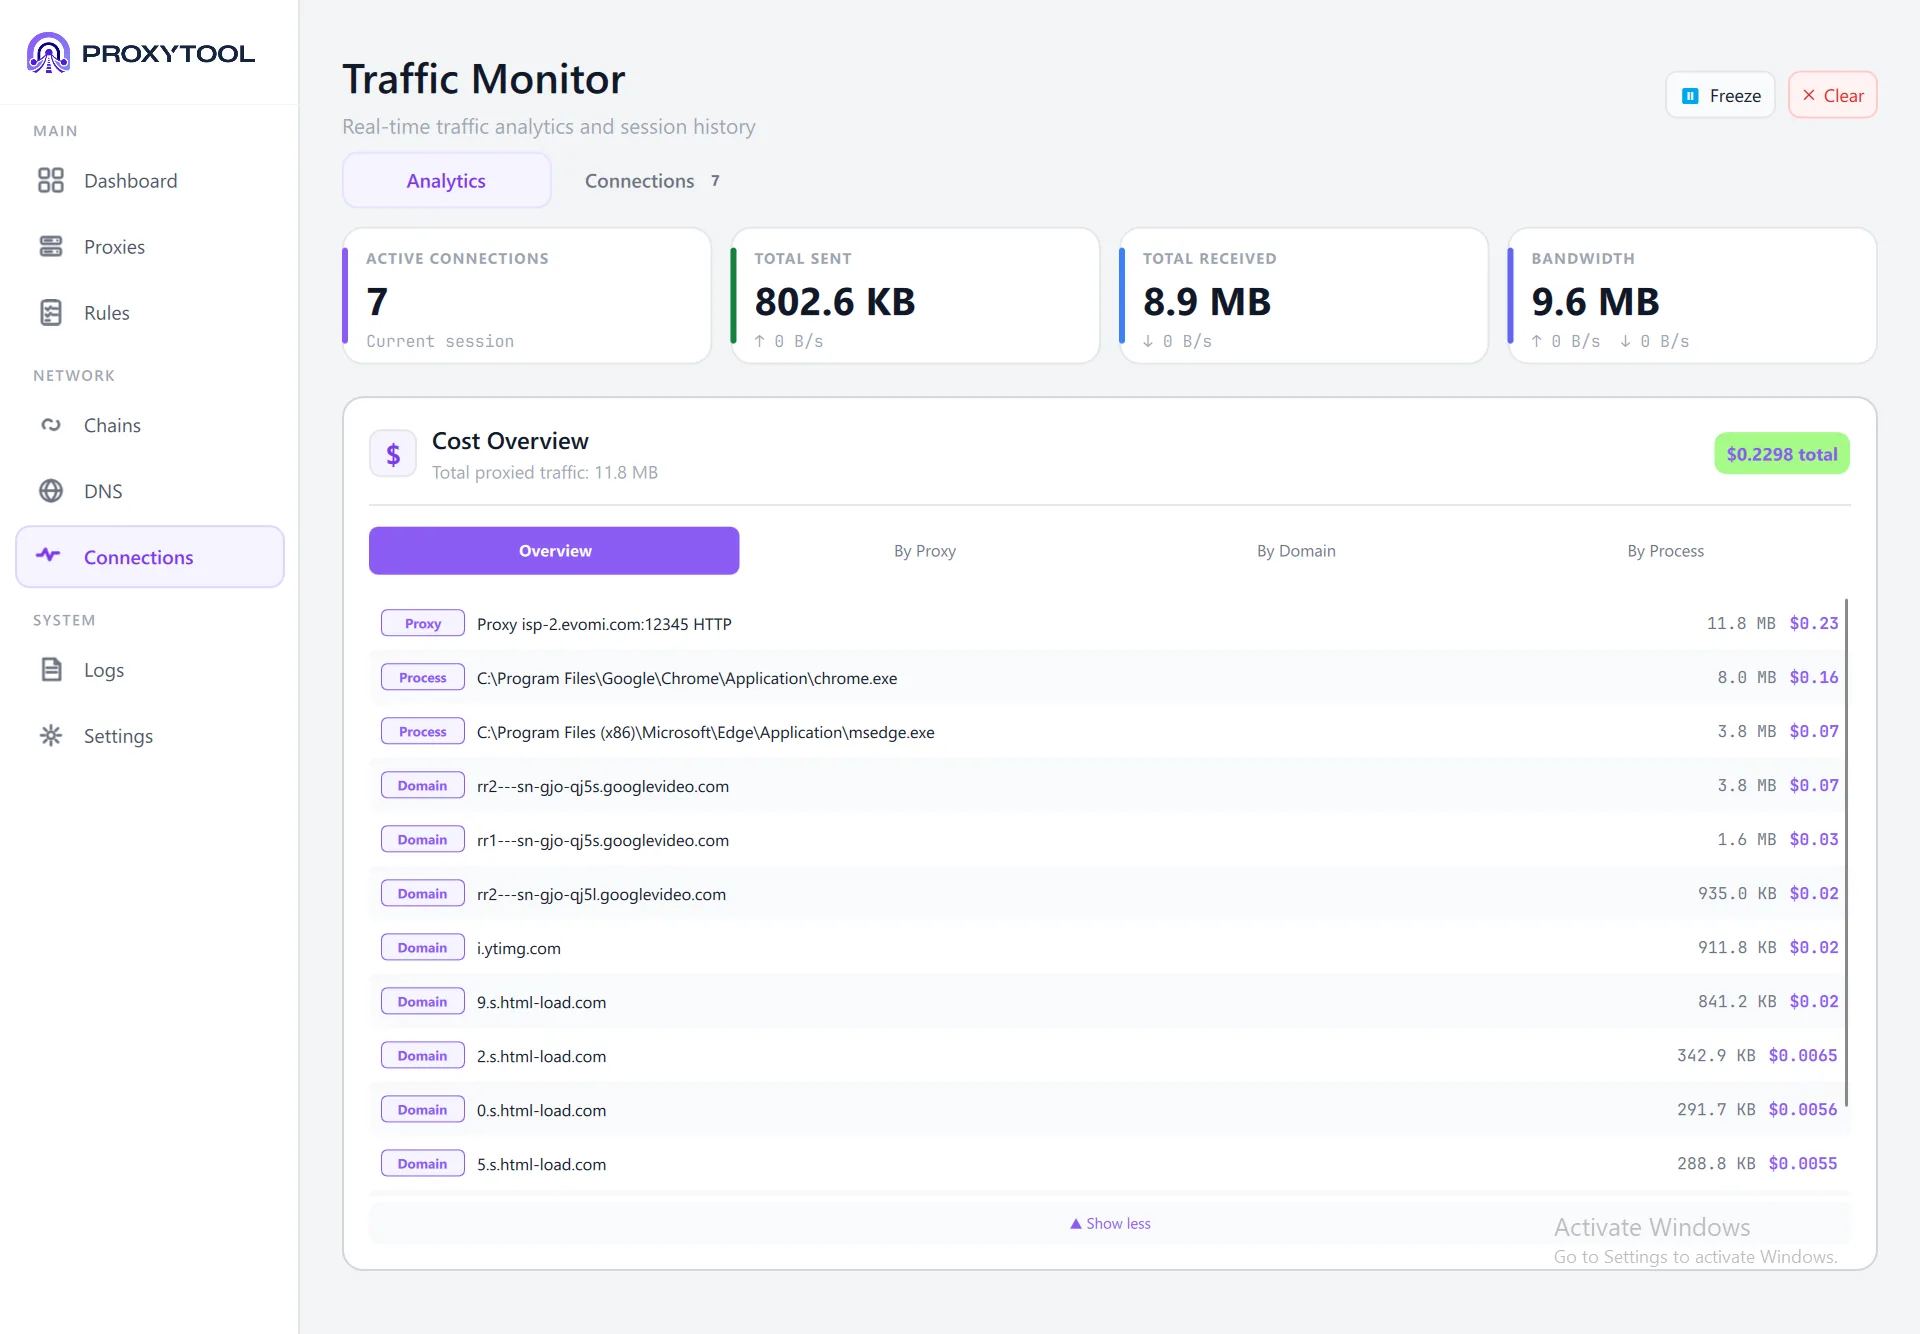
The Cost Overview card calculates real-time proxy expenses based on the per-GB rate you set on each proxy. The total cost badge (e.g. $0.2298 total) appears in the top-right corner. Four tabs let you slice the data differently:
- Overview — Unified ranking of all proxies, processes, and domains sorted by traffic. Each entry shows a type badge (Proxy / Process / Domain), traffic volume, and cost
- By Proxy — Traffic and cost per proxy endpoint with connection count breakdown
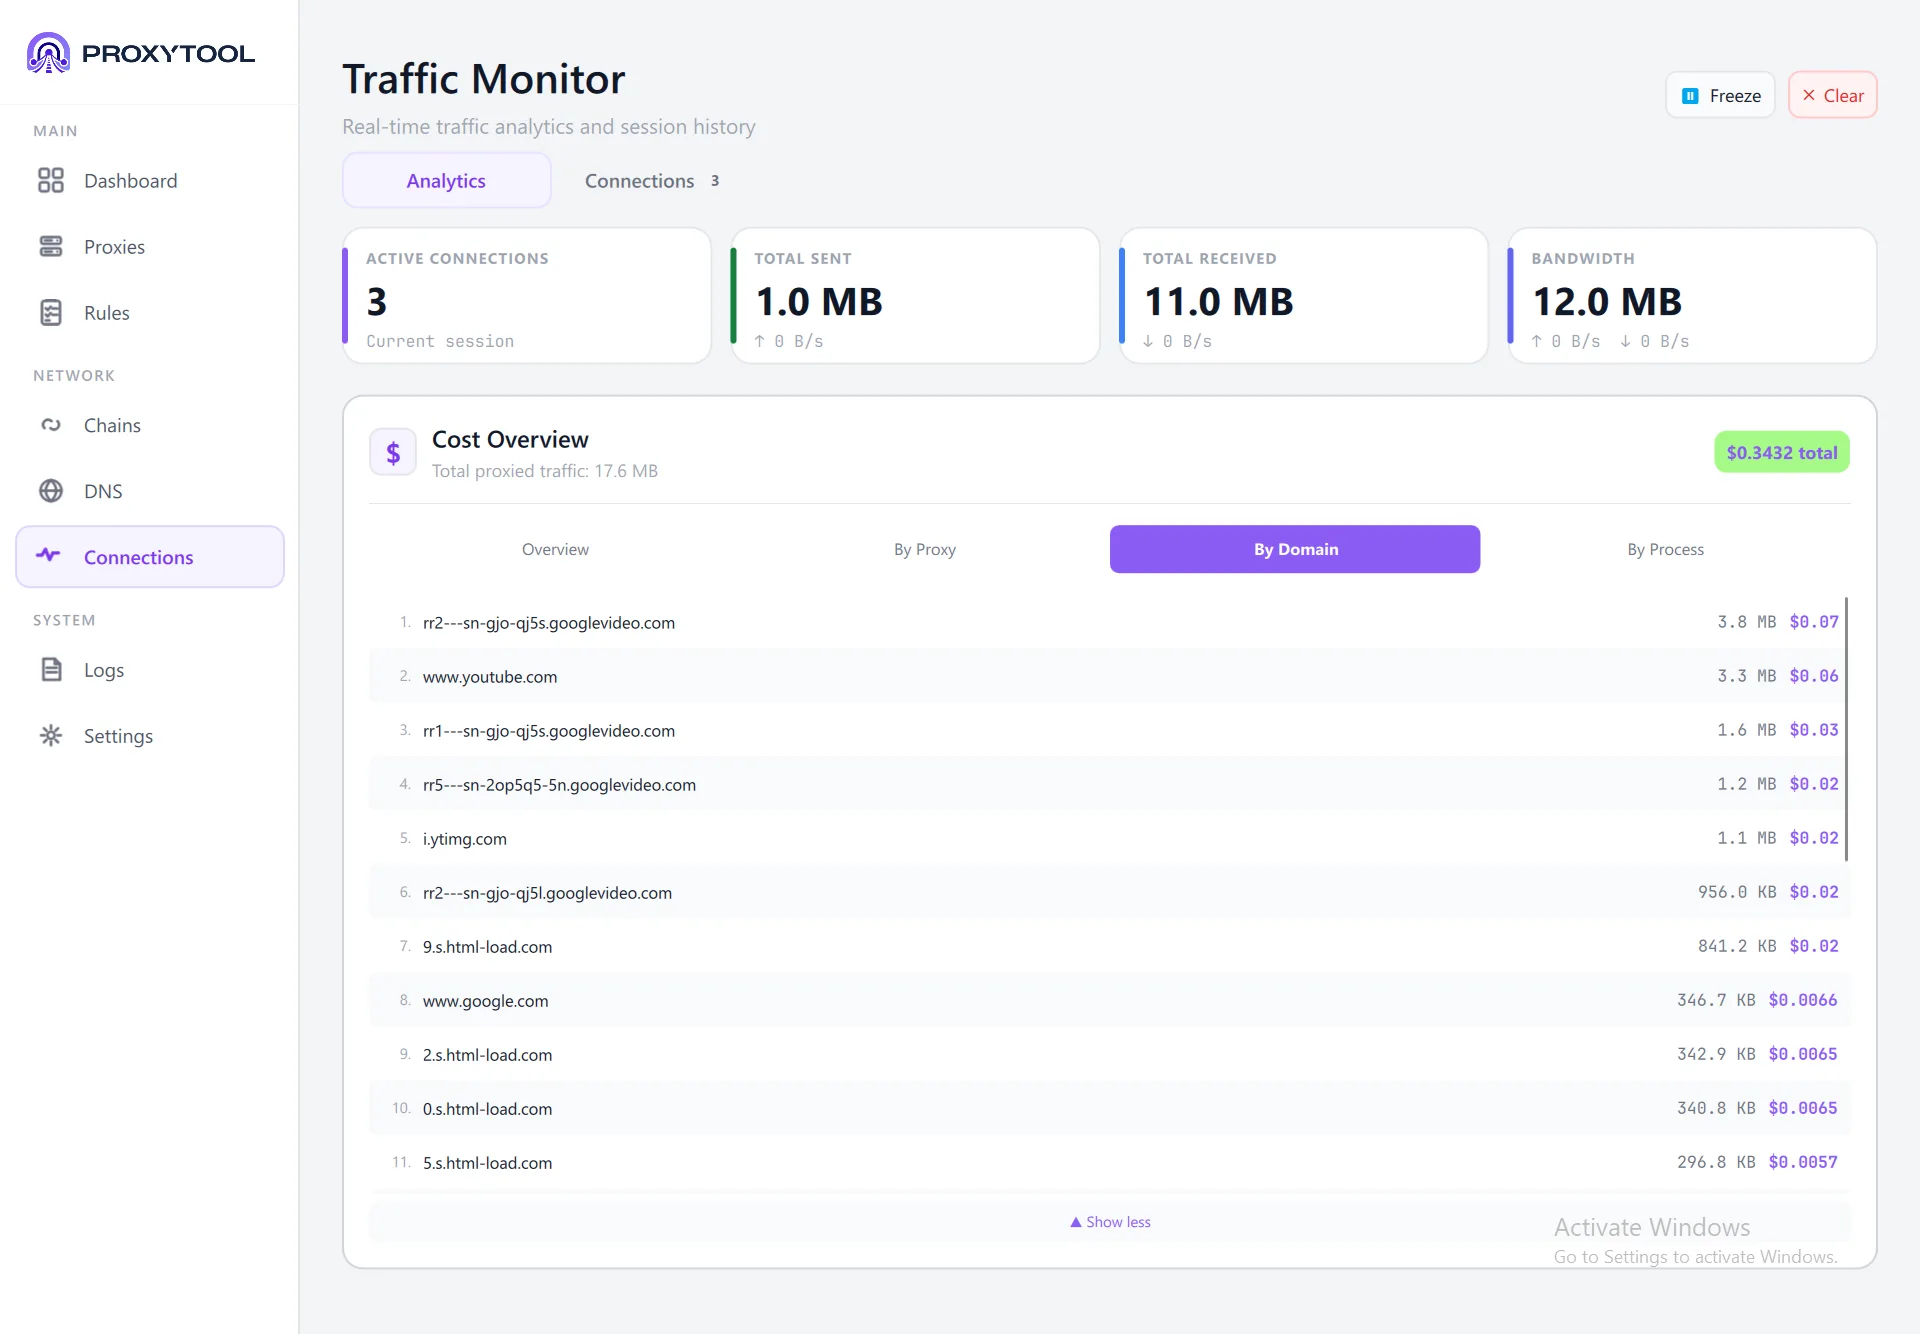
- By Domain — Ranked list of domains by traffic, useful for identifying bandwidth-heavy sites
- By Process — Per-application cost breakdown so you can see which processes generate the most proxy traffic
Cost Optimization
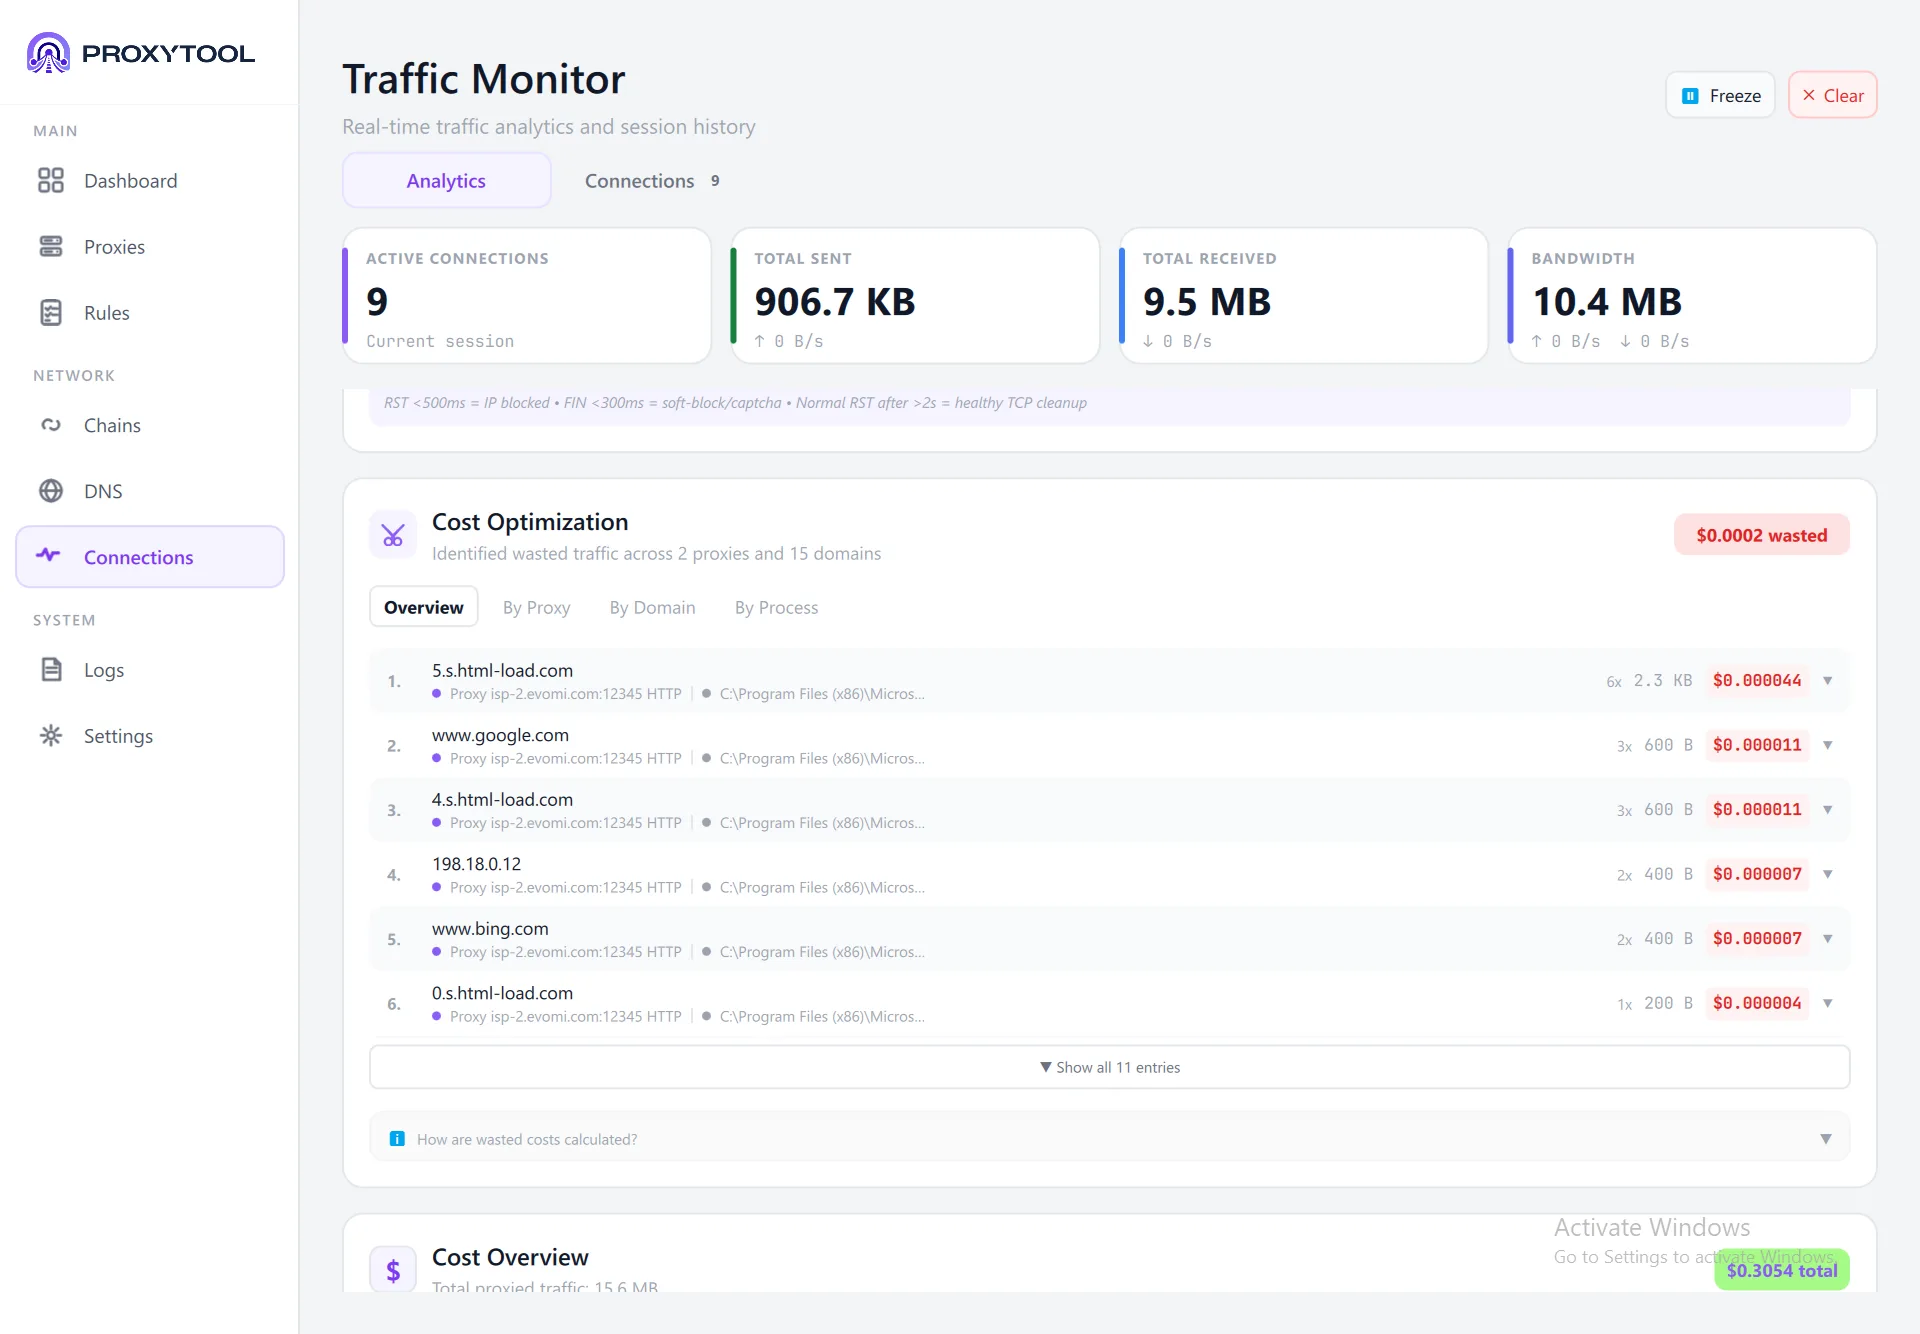
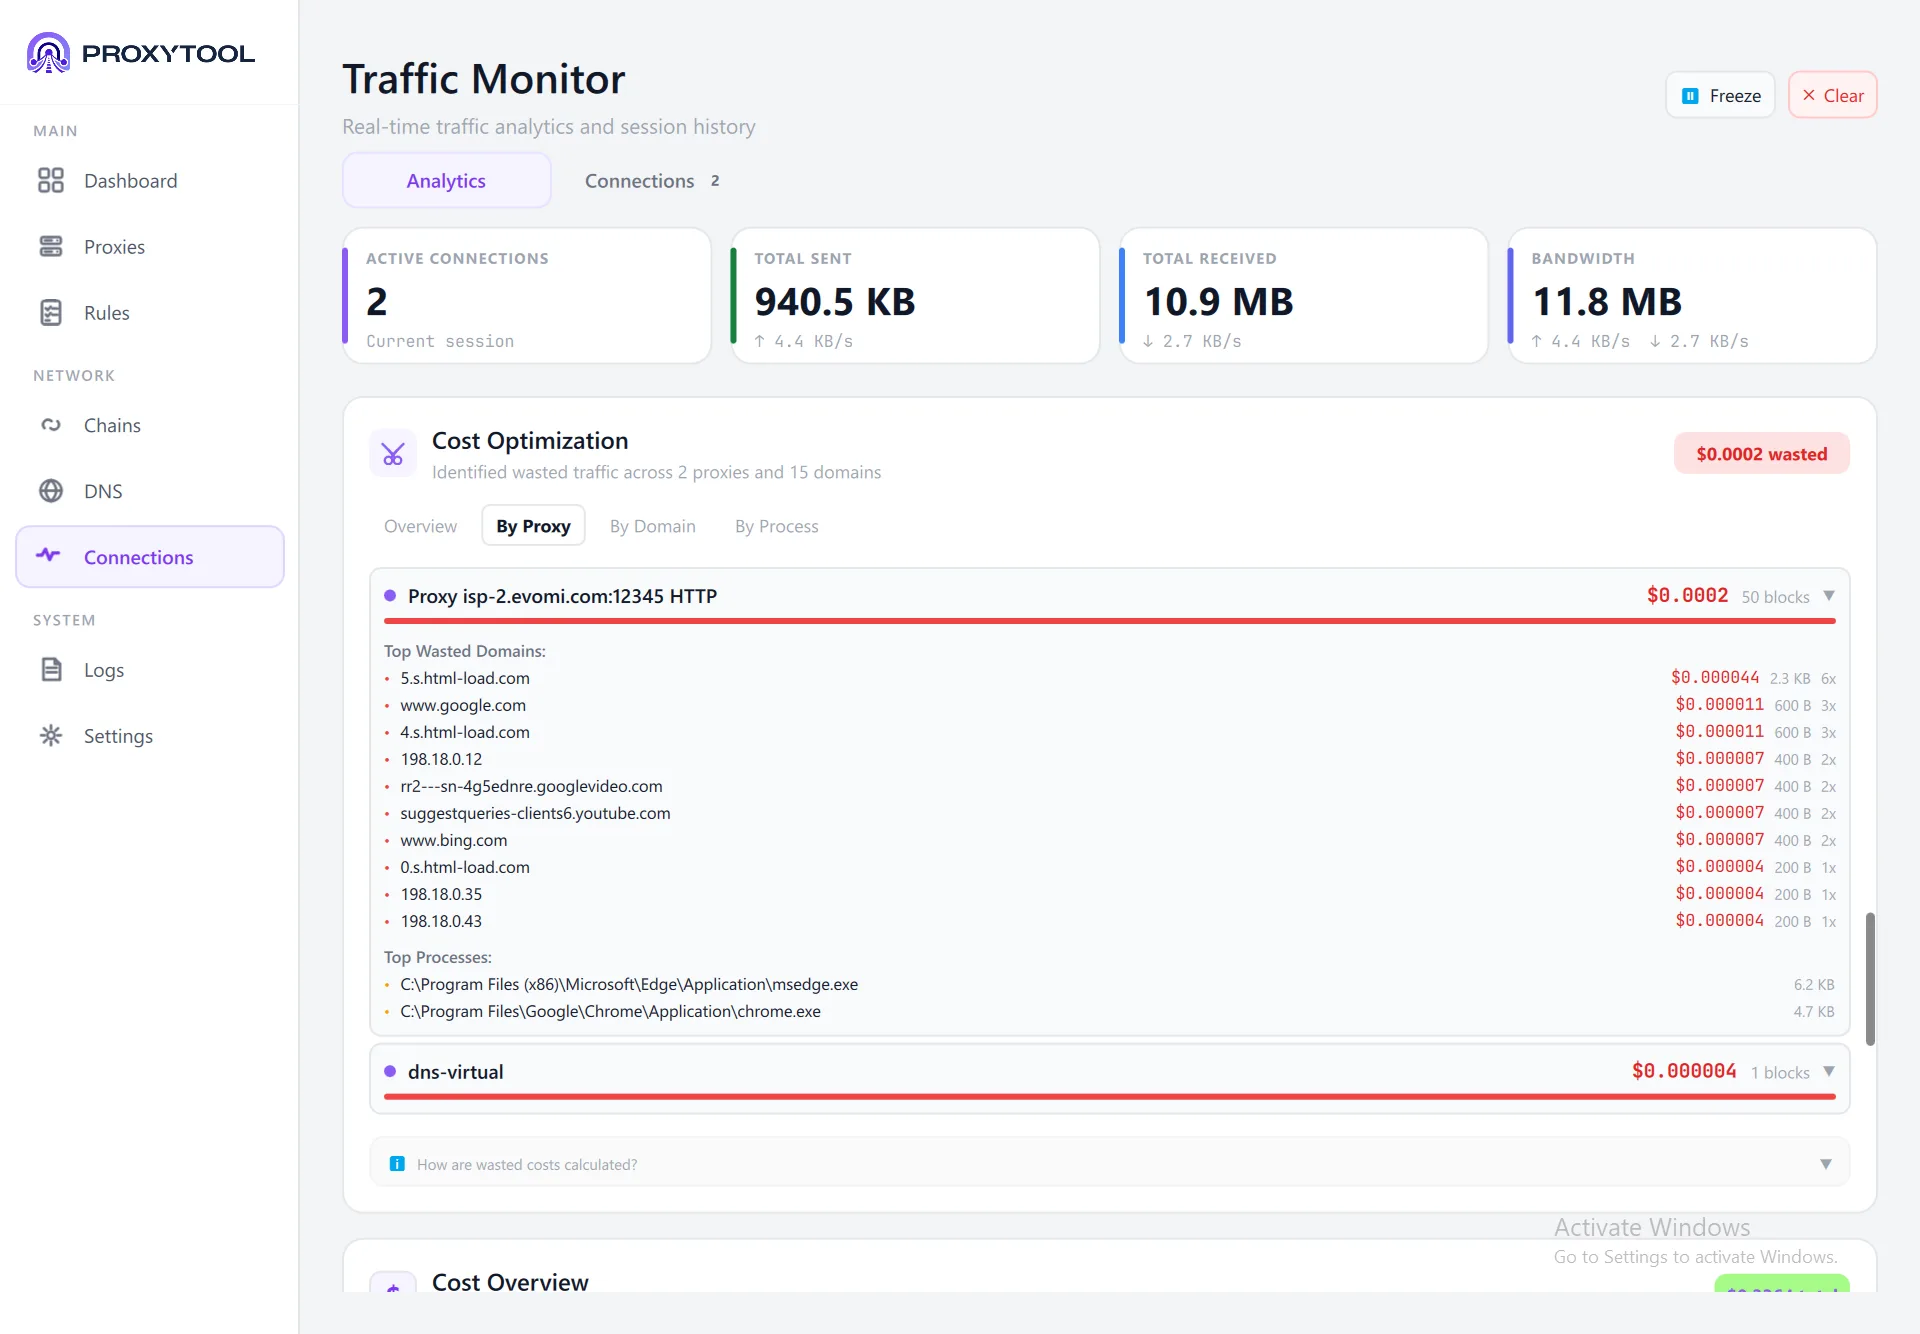
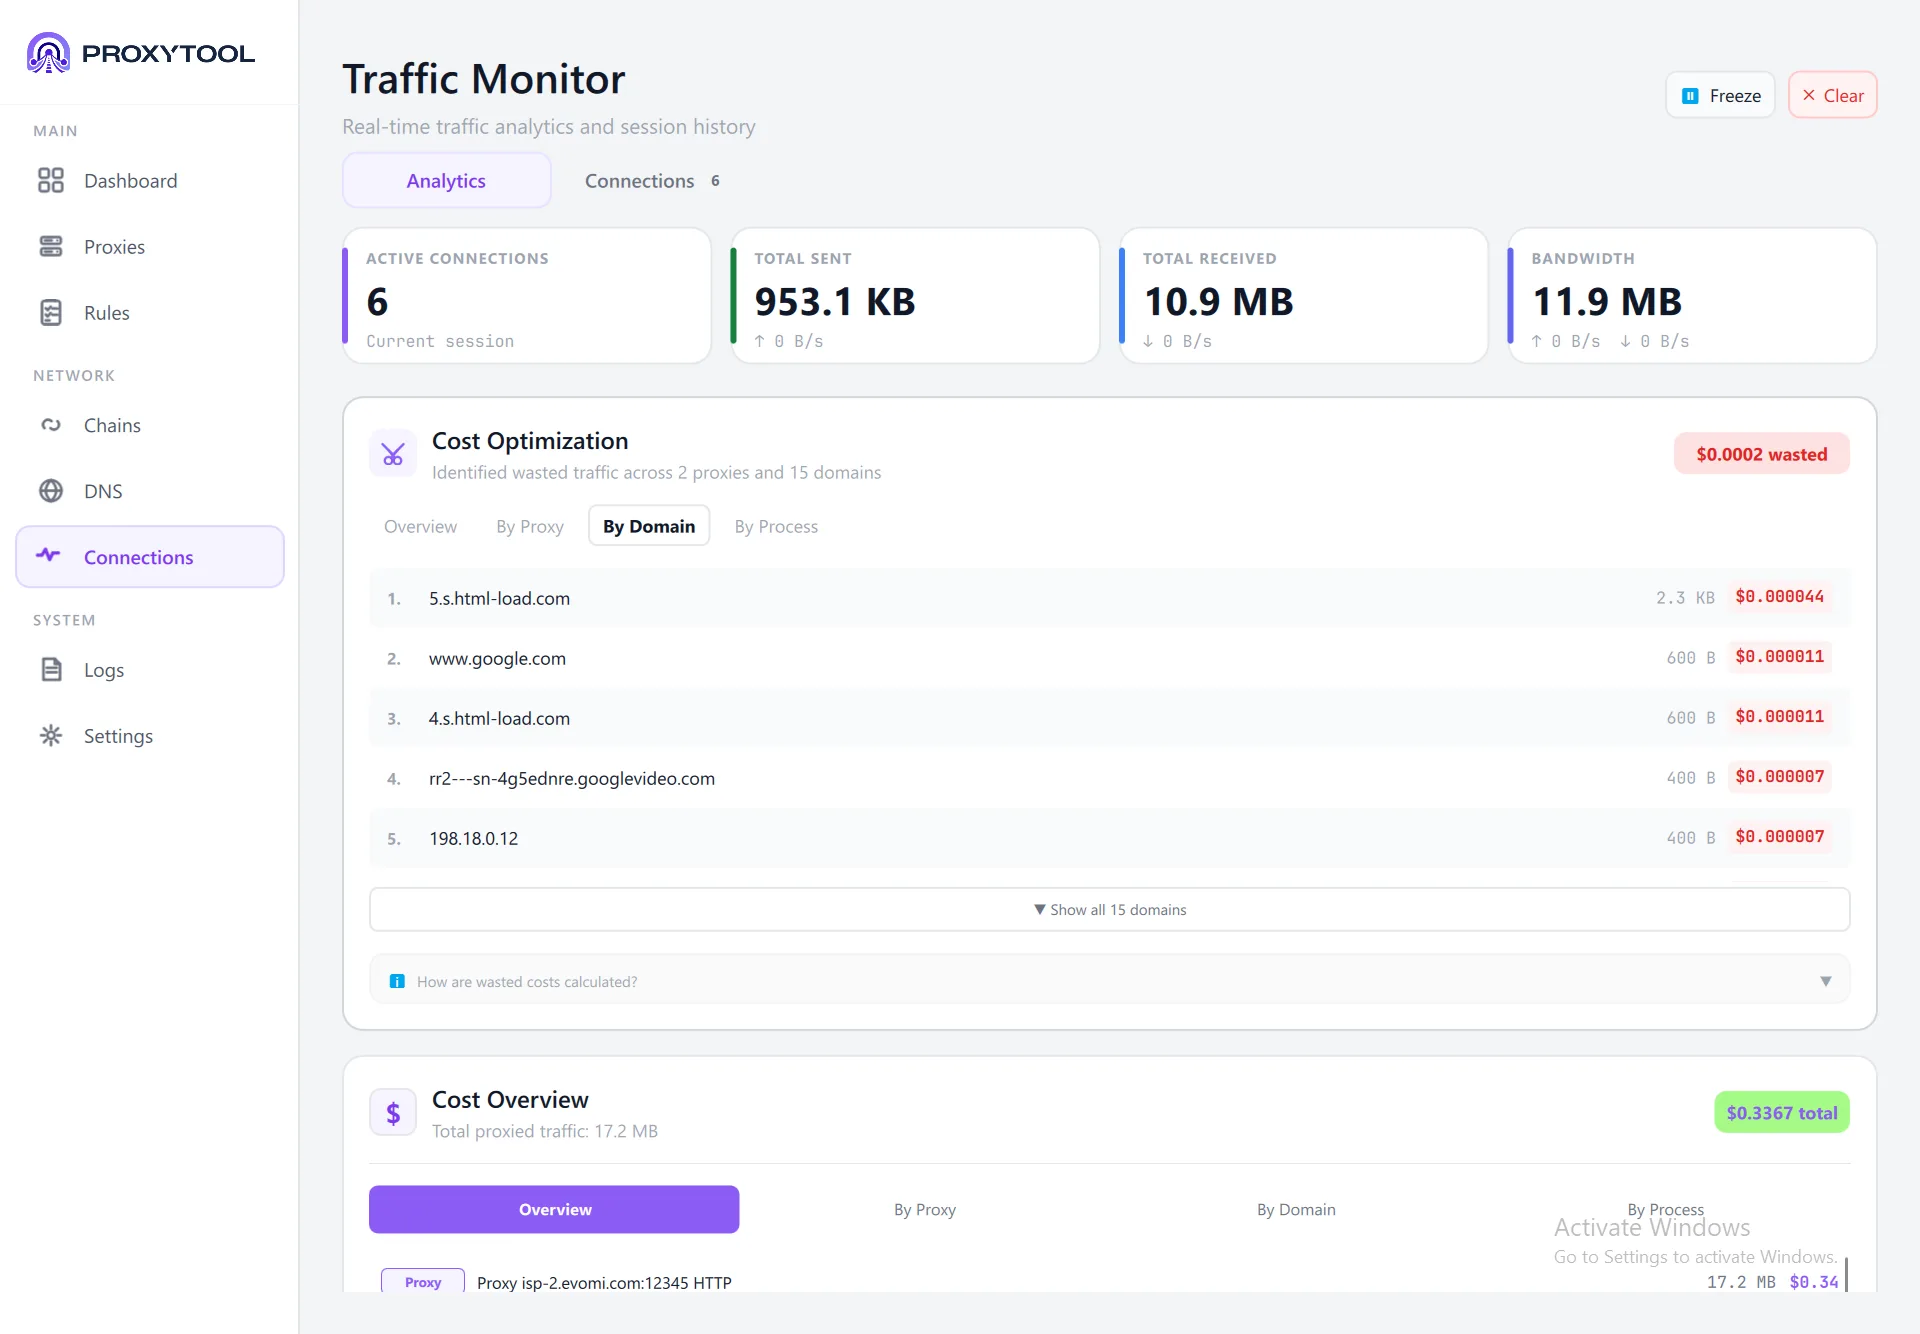
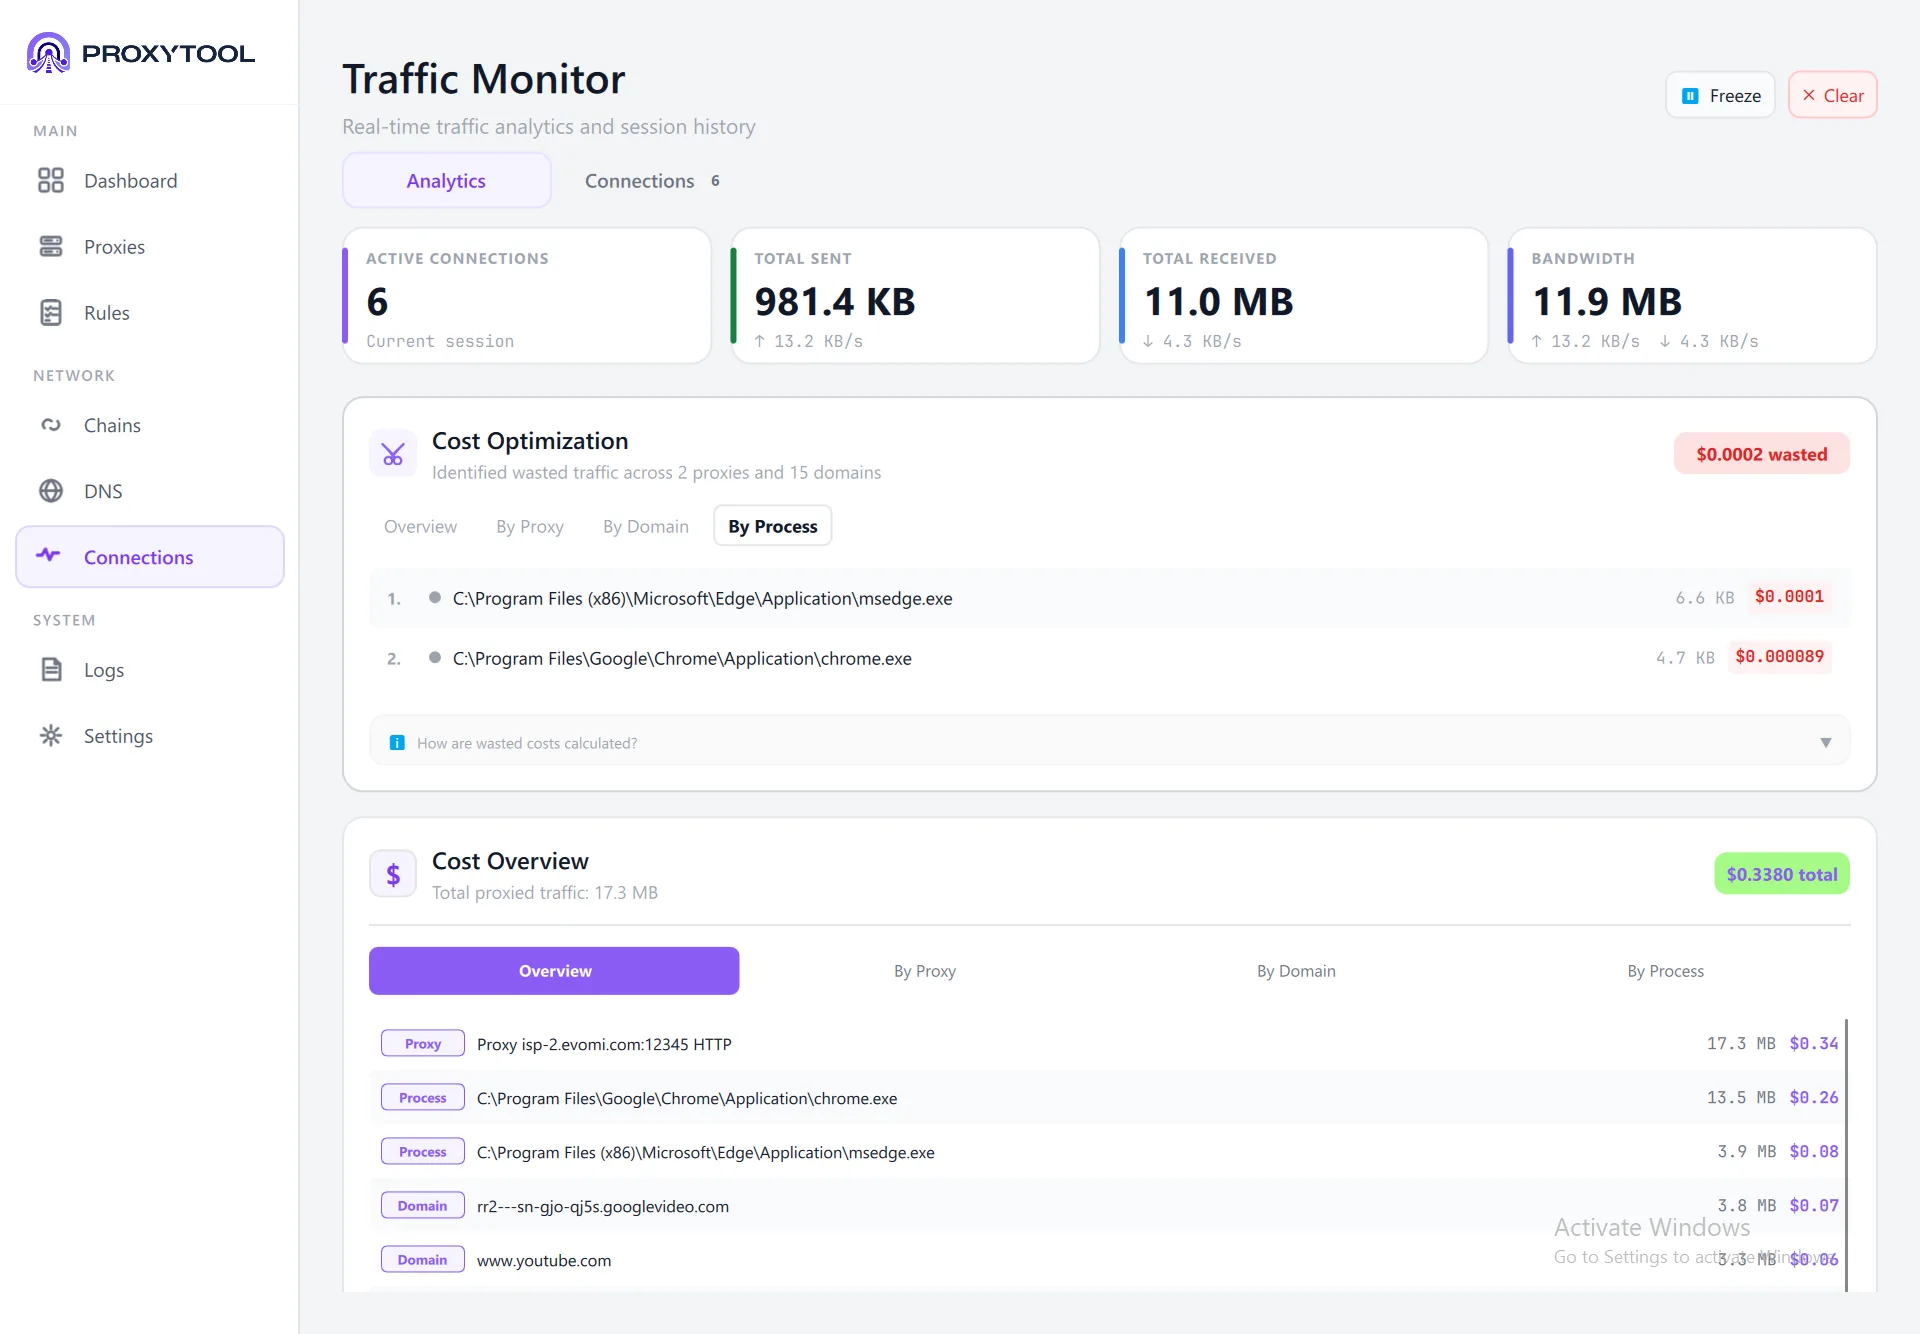
The Cost Optimization card identifies wasted proxy traffic — connections that were blocked or failed (RST) but still consumed bandwidth. The badge (e.g. $0.0002 wasted) highlights the total wasted cost. Click any entry to expand details:
- Overview — Ranked list of domains with wasted bytes, associated proxy and process, and cost per entry
- By Proxy — Click a proxy to see its top wasted domains and processes. Shows total block count, success rate, and block rate per proxy
- By Domain — Wasted traffic grouped by domain name
- By Process — Wasted traffic grouped by application (e.g. msedge.exe, chrome.exe)
TLS Fingerprint Detection
ProxyTool monitors TLS Client Hello packets and compares JA3 fingerprint hashes against a known database. When a connection's fingerprint indicates a potentially detectable automation tool, a warning card appears in the Analytics tab with fix suggestions.
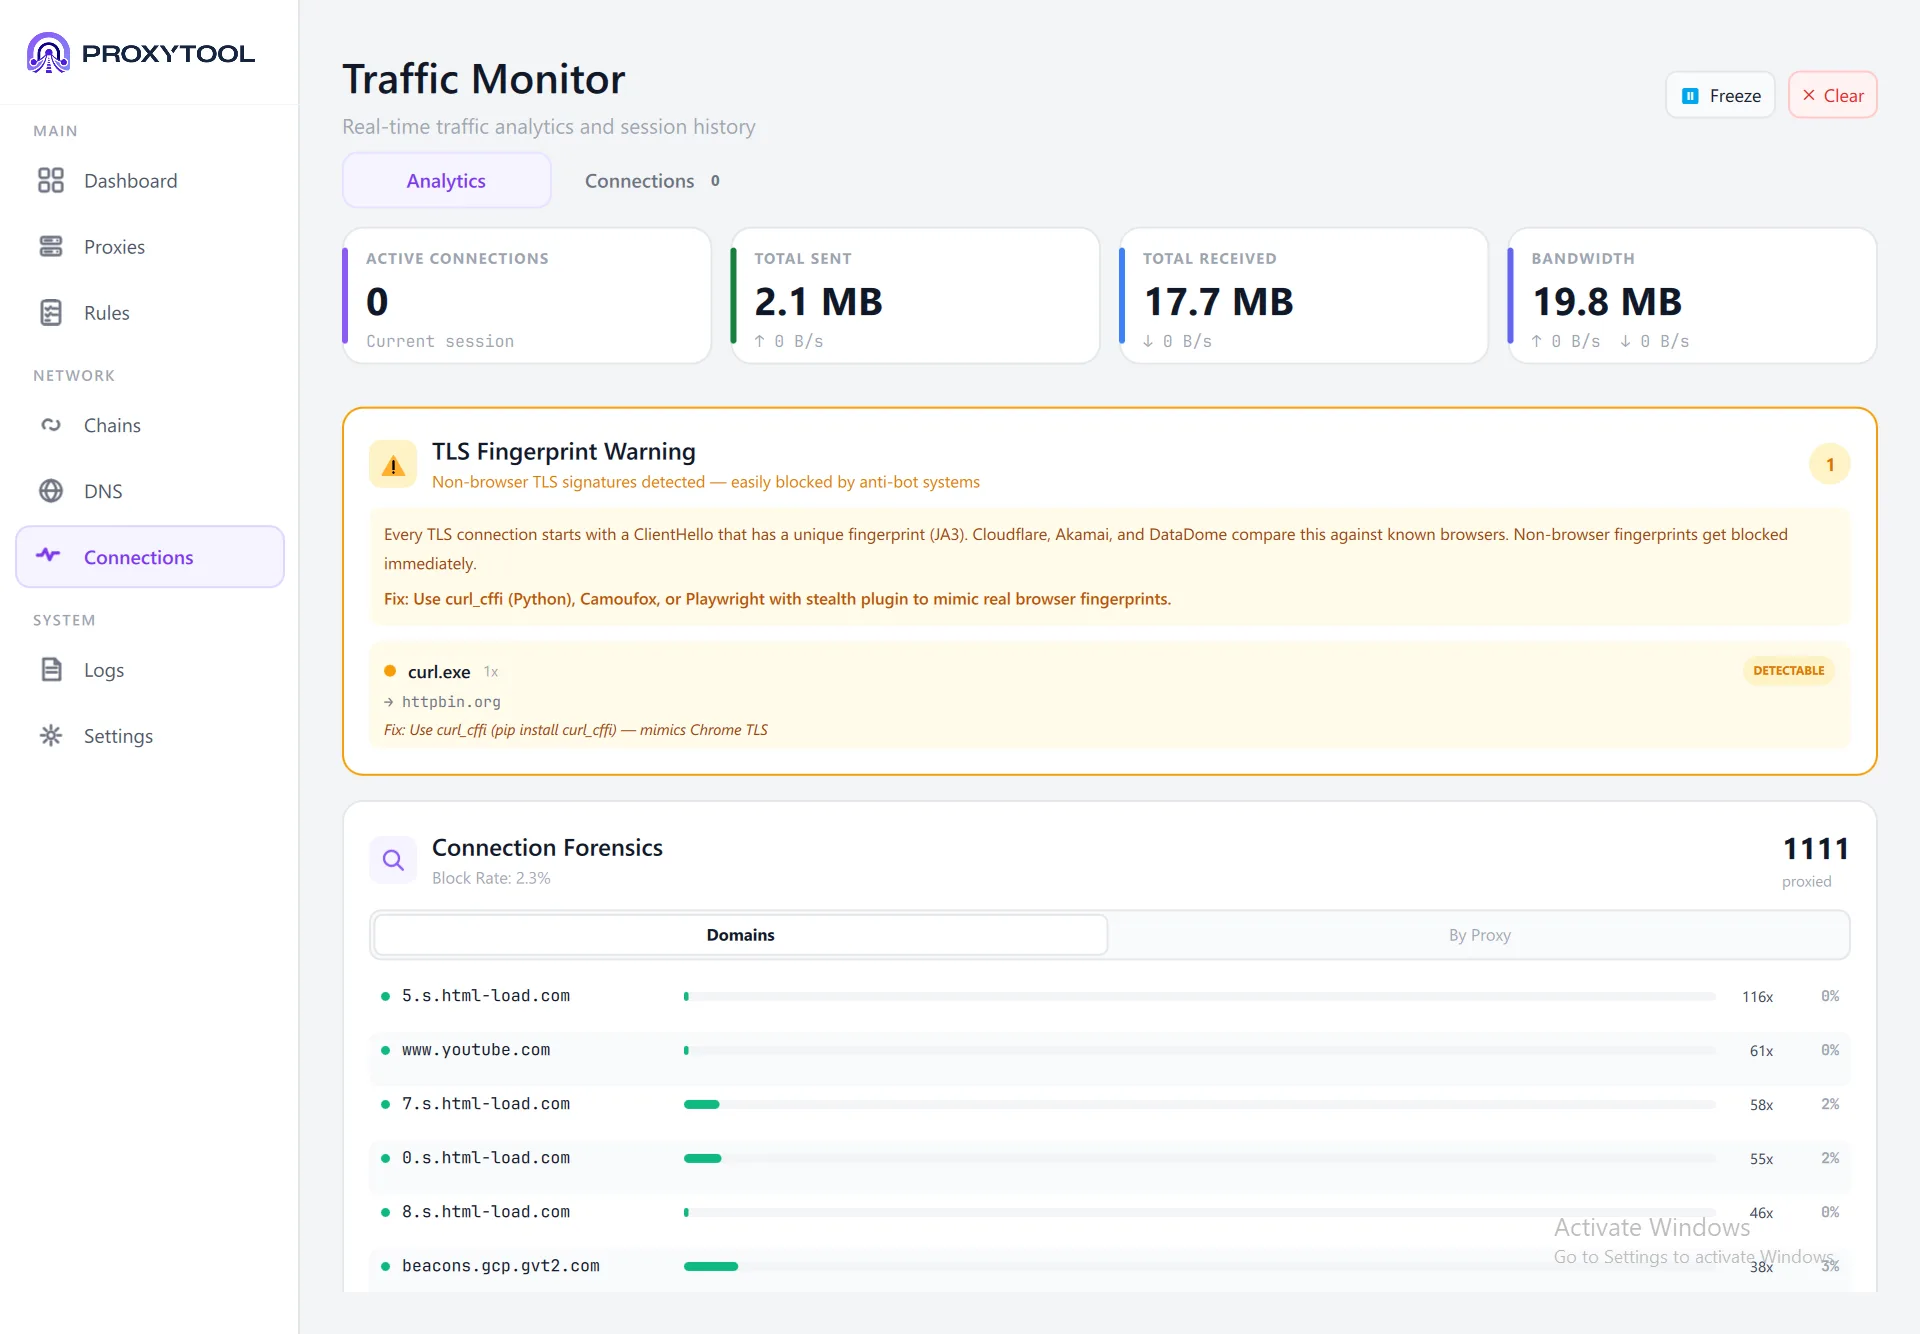
In this example, curl.exe was flagged as DETECTABLE because its TLS fingerprint does not match any known browser. The warning card explains that anti-bot systems like Cloudflare, Akamai, and DataDome compare JA3 hashes against known browsers, and suggests using curl_cffi, Camoufox, or Playwright with stealth plugins instead.
| Risk | Fingerprint Source | Badge | Action |
|---|---|---|---|
| Low | Chrome, Firefox, Safari, Edge (real browsers) | No warning | Normal browser-like traffic — no detection risk |
| Medium | Playwright, Puppeteer, Selenium, curl_cffi, Camoufox | DETECTABLE | Destination may flag as automation — consider fingerprint masking |
| High | Python requests, curl, Go net/http, Java HttpClient, wget, Scrapy | BLOCKED | Known bot fingerprint — likely blocked by anti-bot services |
The warning panel shows: process name, number of flagged connections, affected domains (last 5), and process-specific suggestions for fixing the fingerprint.
Cost Tracking
If you've configured a Cost per GB rate on your proxies, the Monitoring page calculates real-time spending based on actual traffic.
How Cost Is Calculated
cost = (bytes_transferred / 1,073,741,824) × cost_per_gb
- Calculated per proxy based on the rate set in the proxy's configuration
- Includes both upload and download bytes
- Displayed with up to 6 decimal places for precision on small transfers
- Visible in Security Shield events and the Cost Optimization card
Cost Optimization
When you have at least 5 proxied connections, the analytics tab shows a Cost Optimization card that breaks down wasted bandwidth by proxy, domain, and process — helping you identify where to reduce costs.
Application Settings
The Settings page provides centralized control over subscription management, appearance, system behavior, privacy, and diagnostics. A search bar at the top filters settings in real time — type any keyword to locate and navigate directly to the matching setting.
Settings Search
The search bar at the top of the Settings page provides instant filtering. Typing a keyword (e.g. "tray", "DNS", "encryption") highlights and scrolls to the matching setting, making it easy to locate options without browsing through tabs.
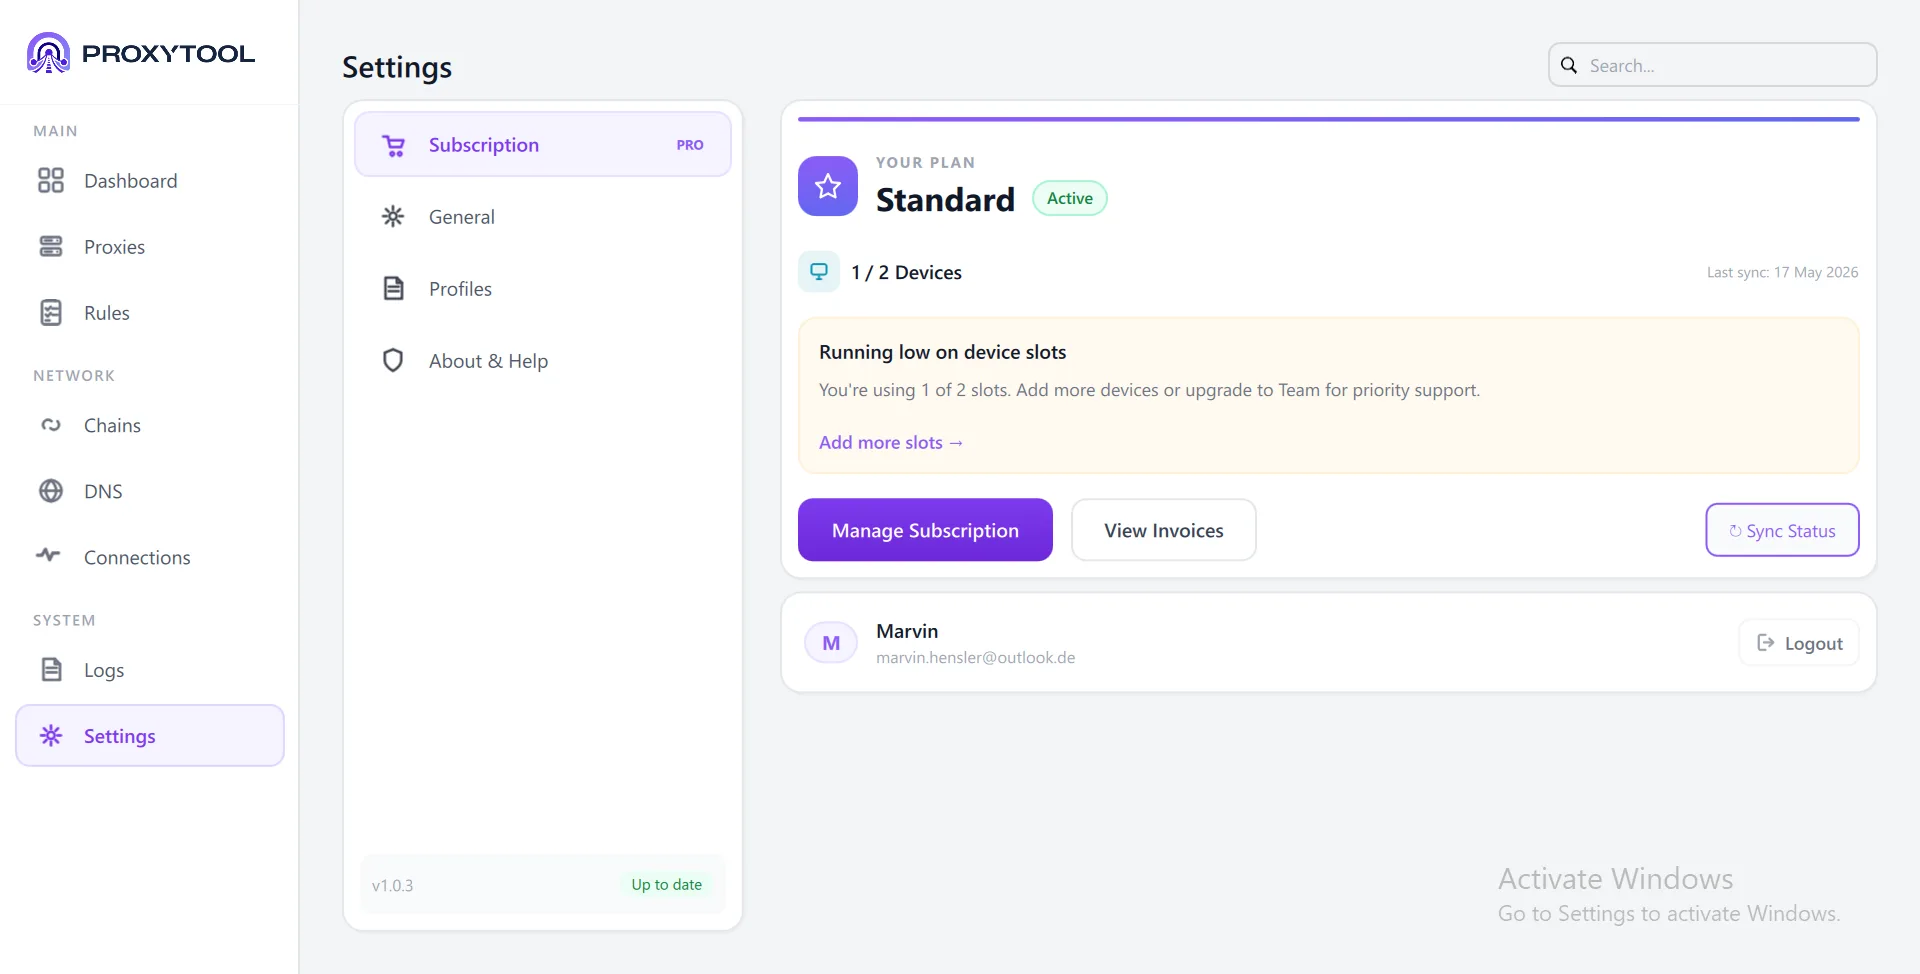
Subscription
| Setting | Description |
|---|---|
| Current Plan | Displays the active subscription tier (Free, Pro, etc.) and expiration date |
| Device Management | Shows the number of device slots used vs. available. Displays a warning when the device limit is reached |
| Sync Status | Indicates whether profile and settings are synced with the cloud account |
| User Account | Shows account name and email. Provides a Logout button to disconnect the device from the account |
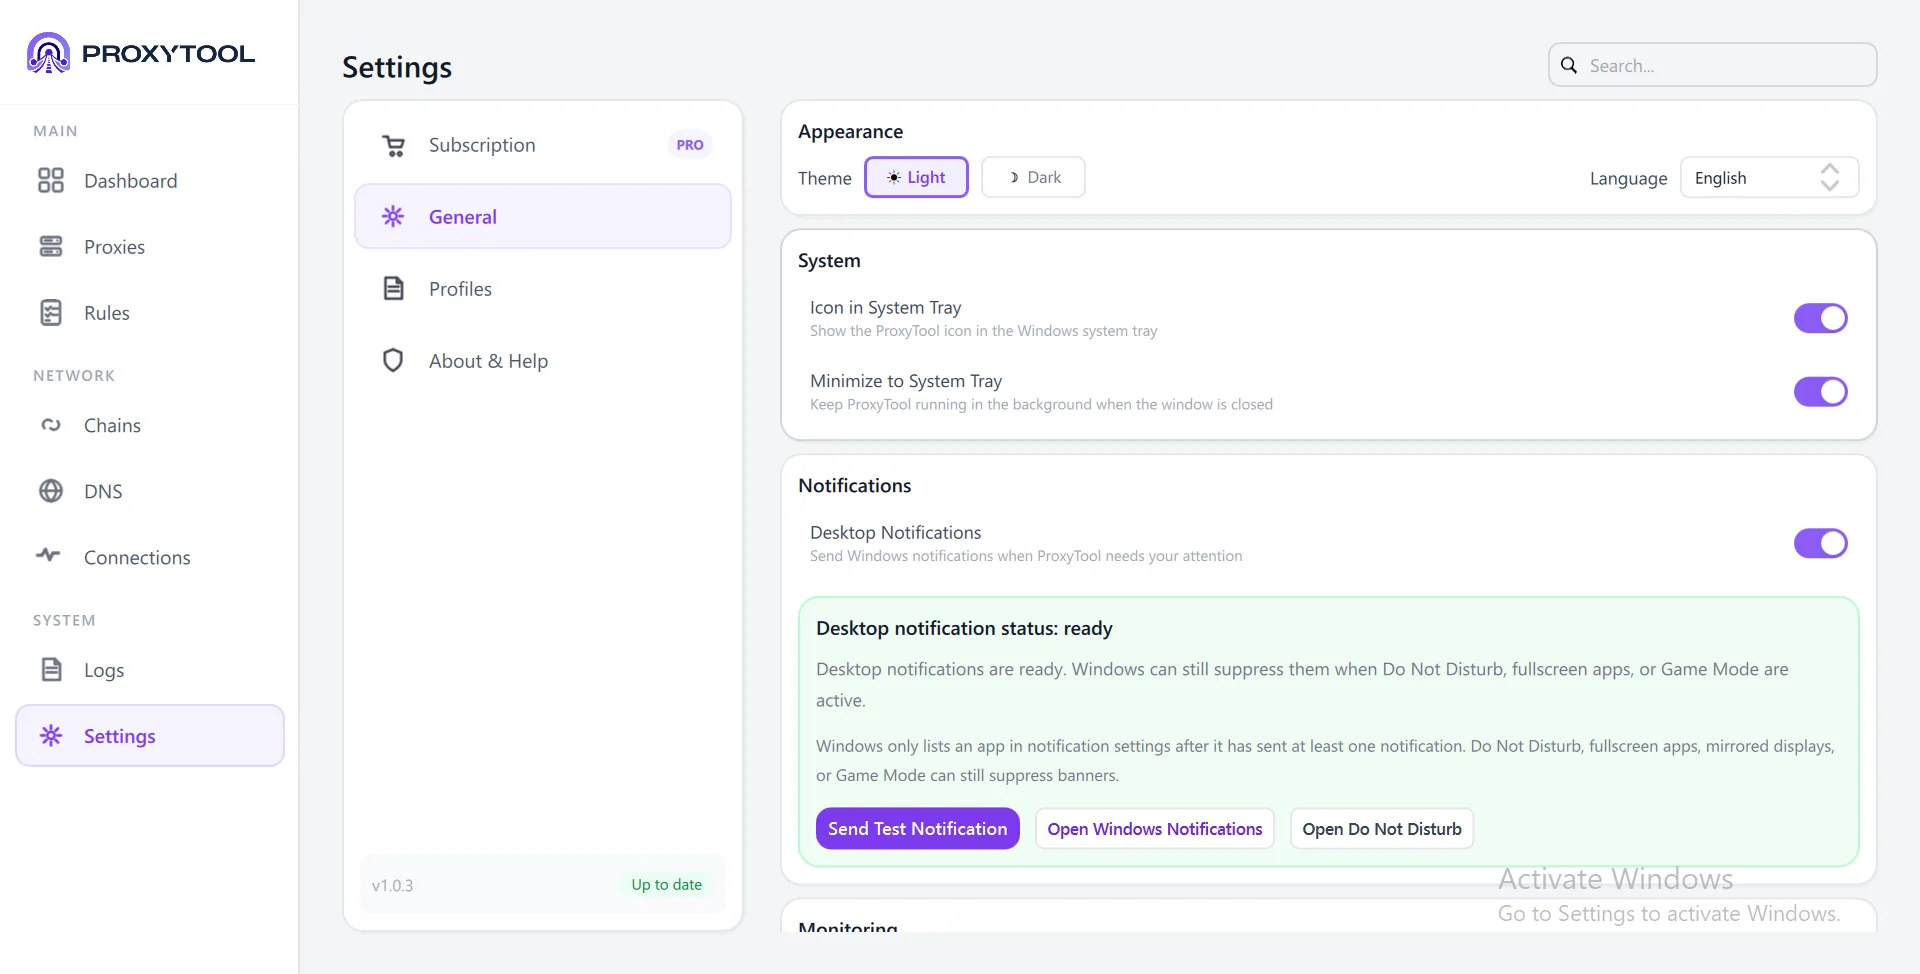
General
| Setting | Default | Description |
|---|---|---|
| Theme | System | Light or Dark appearance |
| Language | English | English or Deutsch |
| System Tray Icon | On | Show ProxyTool icon in the notification area |
| Minimize to Tray | On | Close button minimizes to tray instead of quitting |
| Desktop Notifications | On | Show system notifications for connection events |
| Show Traffic on Tray Icon | On | Display live upload/download activity on the tray icon |
| Show Direct Connections | On | Include bypassed (direct) traffic in logs and monitoring |
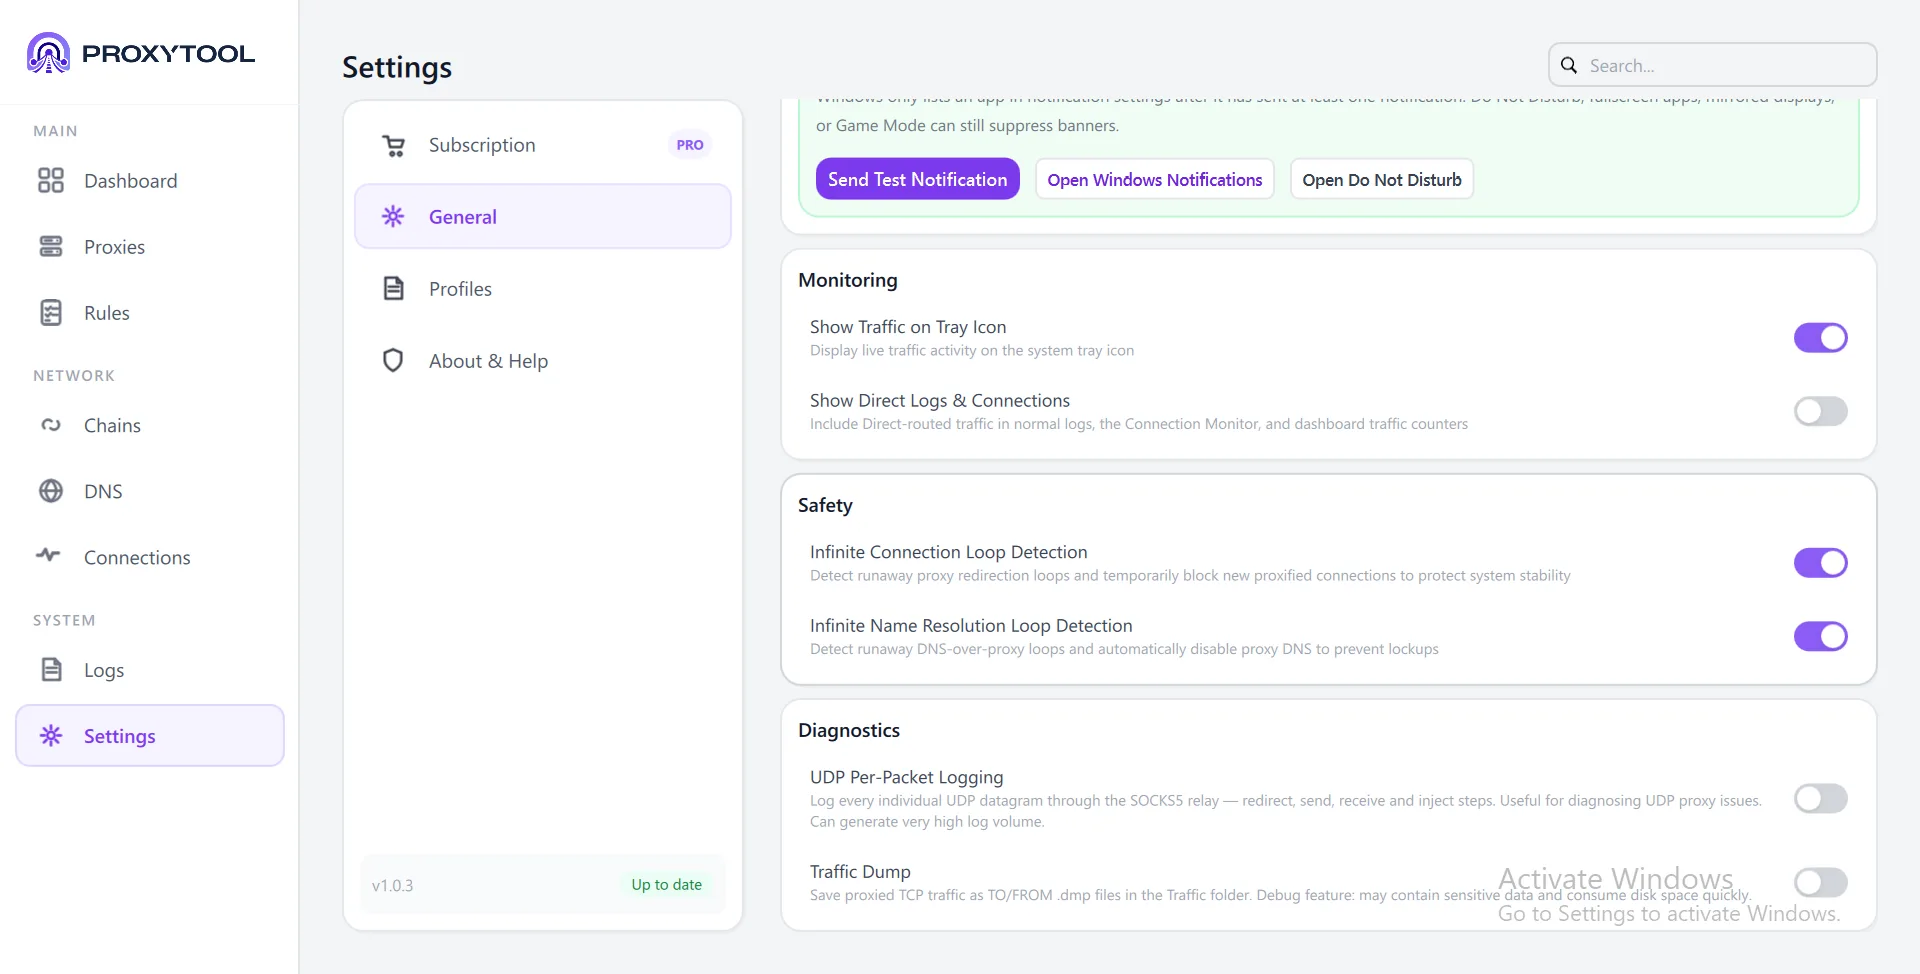
Safety
| Setting | Default | Description |
|---|---|---|
| Connection Loop Detection | On | Detects and blocks runaway proxy redirection loops |
| DNS Resolution Loop Detection | On | Detects DNS-over-proxy loops and auto-disables proxy DNS to prevent lockout |
Diagnostics
| Setting | Default | Description |
|---|---|---|
| Traffic Dump | Off | Save proxied TCP traffic as .dmp files for debugging. Warns when files exceed 1000 or 500 MB total |
Profiles & Migration
Profiles save your complete configuration (proxies, chains, rules, DNS settings) as portable .ppx files. You can maintain multiple profiles and switch between them.
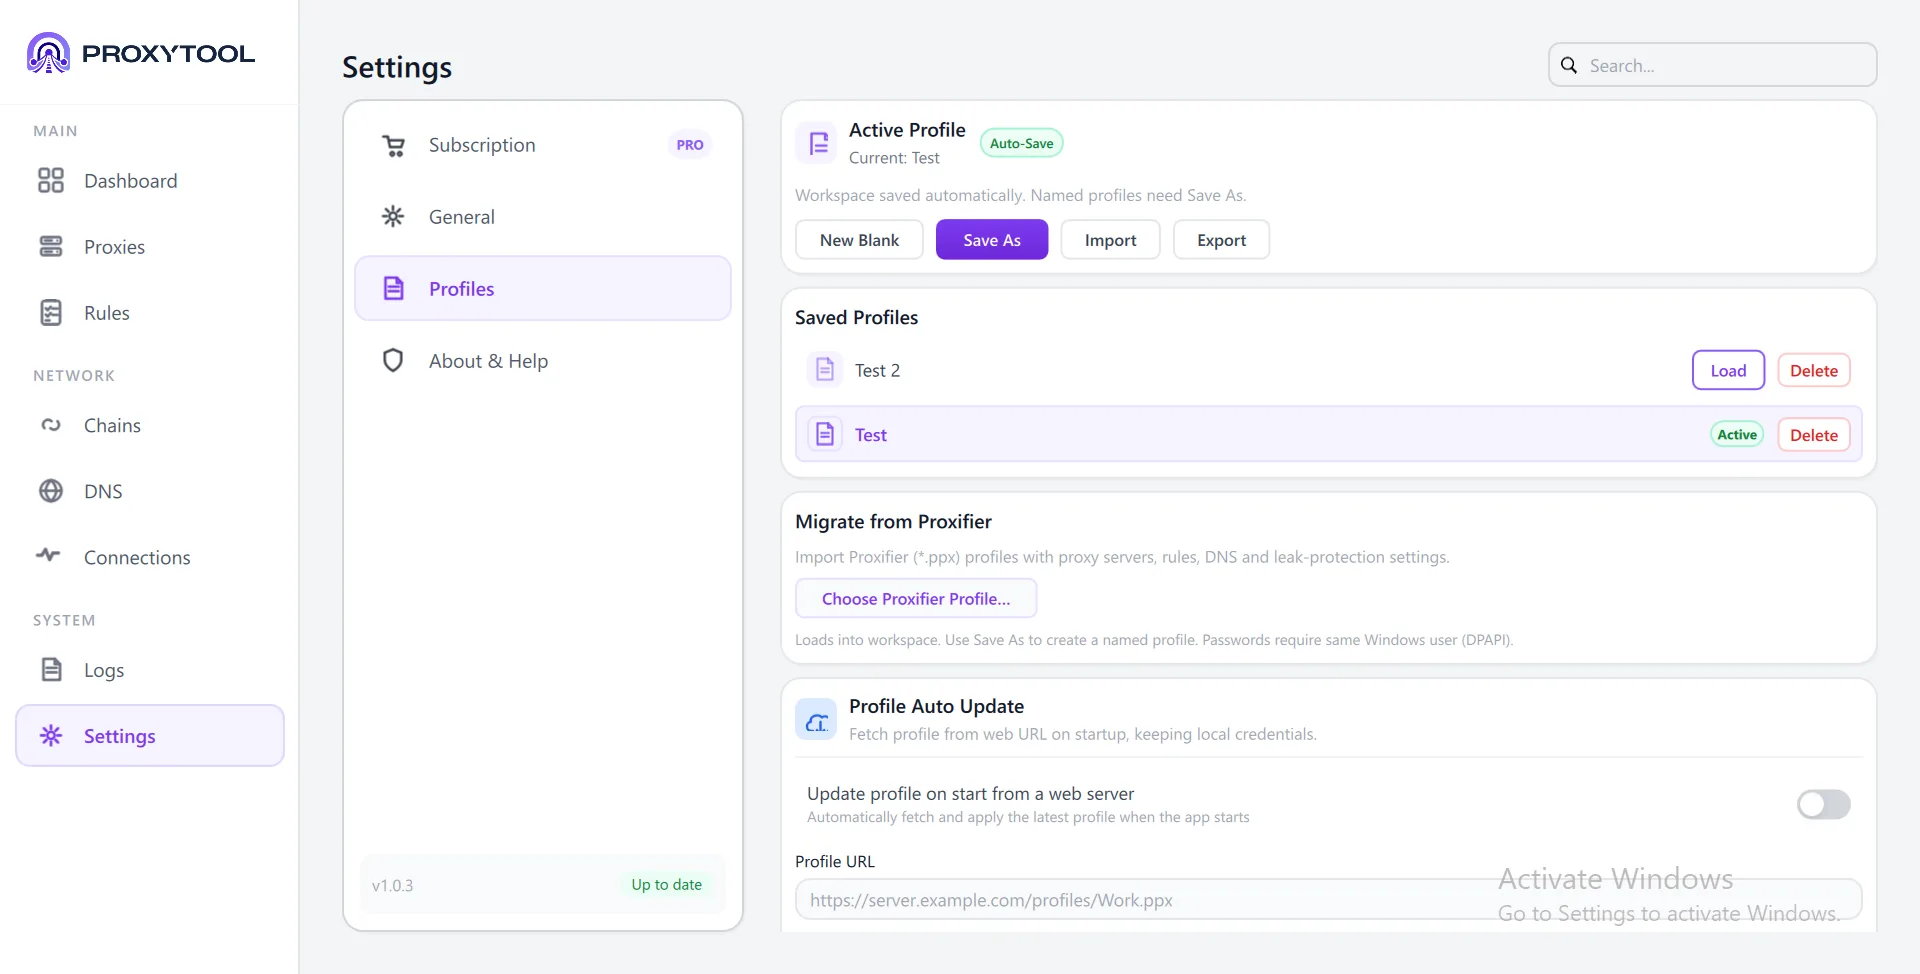
Active Profile
The current workspace is auto-saved continuously. To persist a configuration as a named profile, use Save As. The active profile name is displayed at the top of the Profiles tab. Additional controls include:
- New Blank — Reset to a clean empty configuration
- Save As — Save current workspace as a named profile
- Import — Load a
.ppxfile from disk (or a Proxifier.ppx/.xml) - Export — Save the current configuration to a file for sharing or backup
Saved Profiles
All saved profiles appear in a list below the active profile. Each entry shows the profile name and provides Load and Delete actions. The currently active profile is highlighted. Loading a profile replaces the entire active workspace configuration.
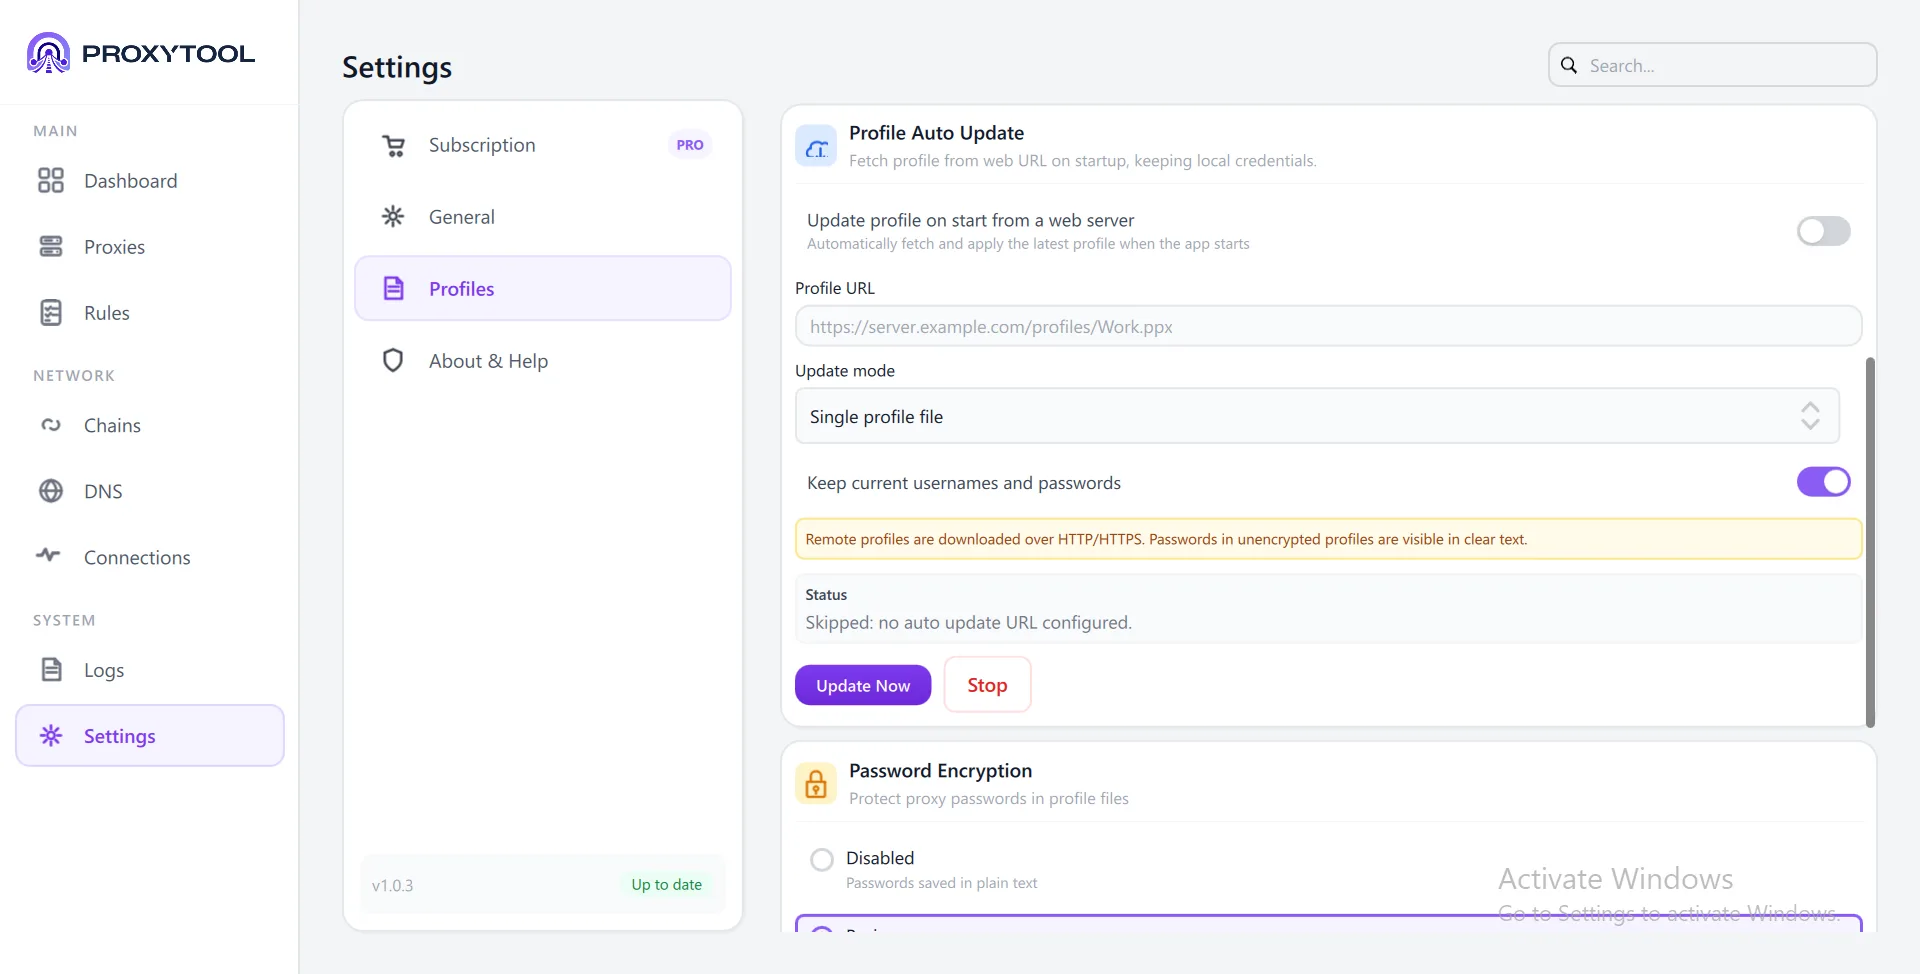
Profile Auto Update
Profiles can be fetched automatically from a remote server. This is useful for team deployments or managed environments where configuration changes need to propagate to all devices.
| Setting | Description |
|---|---|
| Auto Update Toggle | Enable or disable automatic profile fetching at startup |
| URL | Remote URL pointing to a .ppx file or a folder containing multiple profiles |
| Update Mode | Dropdown to select update behavior (e.g. replace entire profile, merge additions only) |
| Keep Credentials | When enabled, existing proxy passwords are preserved during the update |
| Update Now / Stop | Manually trigger an immediate update or cancel an in-progress fetch |
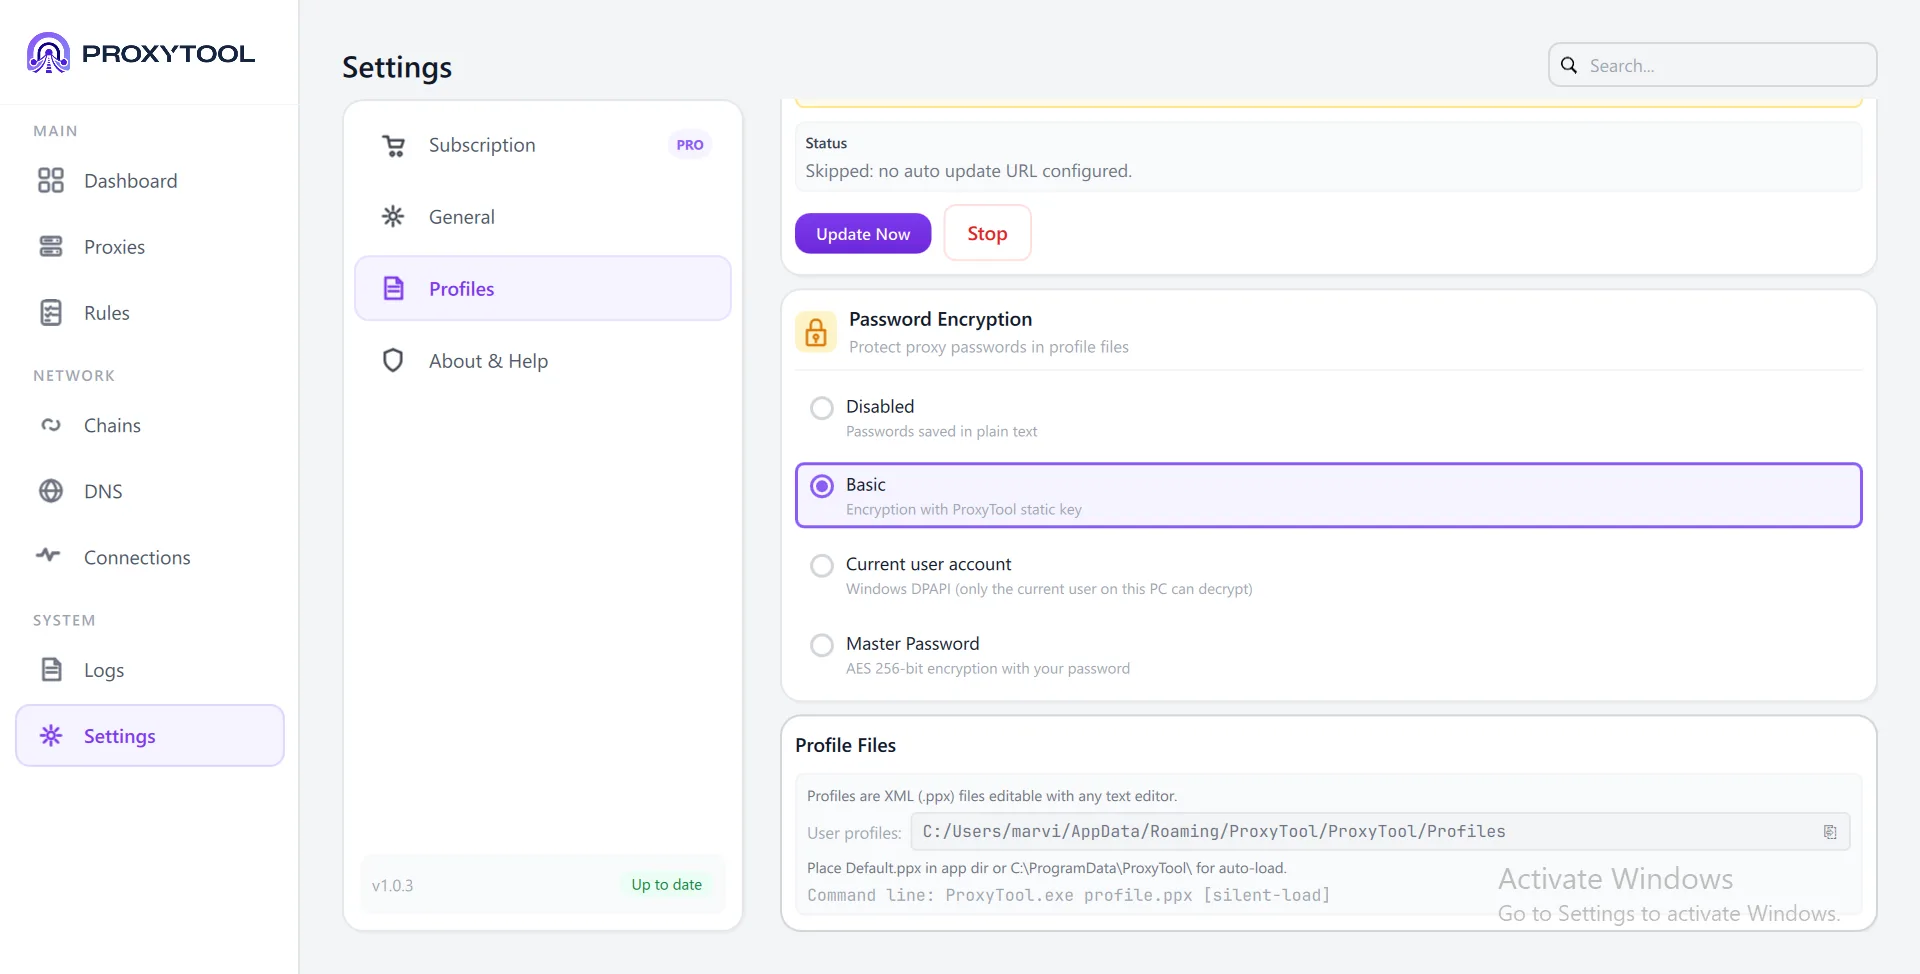
Password Encryption
Profile files can encrypt stored proxy passwords using one of four modes. The encryption mode selector is a radio button group in the Profiles tab.
| Mode | Security Level | Notes |
|---|---|---|
| Disabled | None | Passwords stored as plain text in profile |
| Basic | Medium | Encrypted with ProxyTool static key (portable between devices) |
| Current User Account | High | Encrypted with Windows DPAPI — locked to the current user account on this device |
| Master Password | Highest | AES-256 encryption with a user-chosen master password. Portable between devices; password is required each time the profile is loaded |
Profile Files
Profiles are stored as XML .ppx files. The Profiles tab shows the user profile directory path with a copy button for quick access in file explorer.
- User profile directory — Default location where named profiles are saved
Default.ppx— Place this file in the application directory orC:\ProgramData\ProxyTool\to auto-load a profile for all users on the machine- CLI loading — Run
ProxyTool.exe profile.ppx [silent-load]to load a specific profile at launch. Thesilent-loadflag suppresses the load confirmation dialog
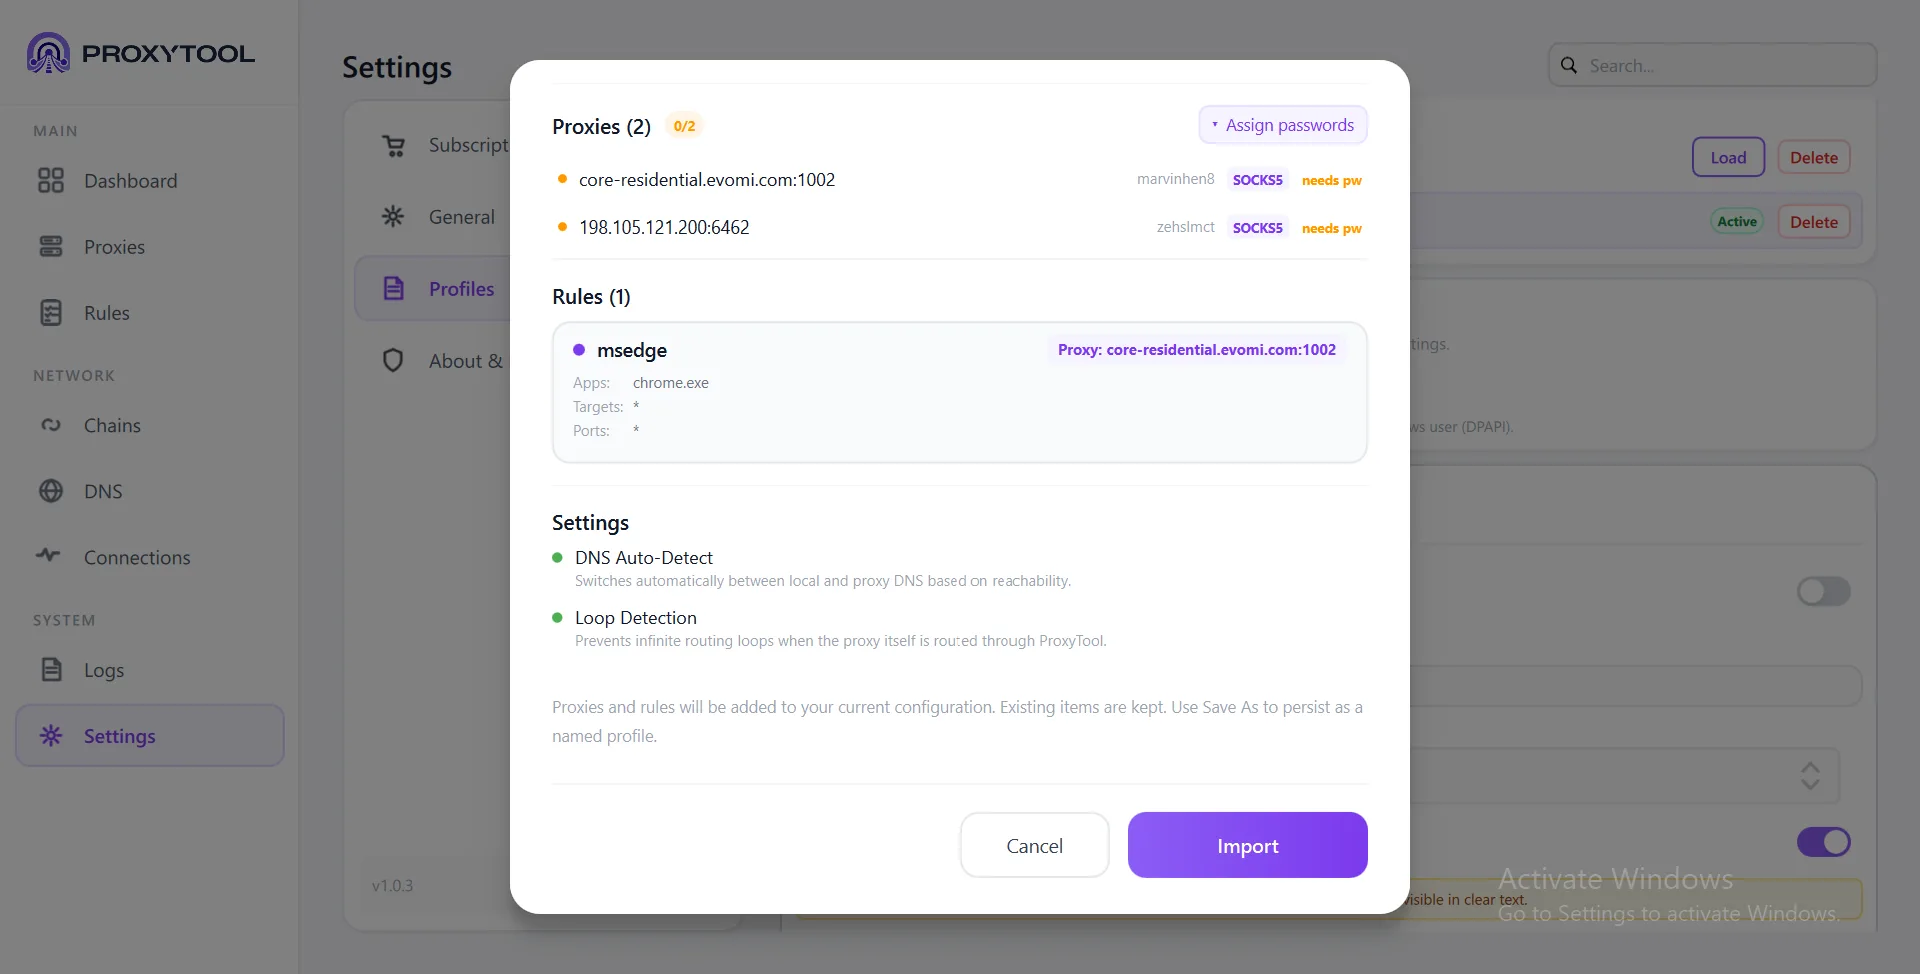
Migrate from Proxifier
ProxyTool can import your existing Proxifier configuration (.ppx / .xml) including proxy servers, chains, rules, DNS settings, and leak-protection options. The import wizard detects all components and guides you through any manual steps required.
What It Imports
- Proxy servers — Host, port, protocol, and authentication credentials
- Proxification rules — Application-based routing rules (process name → proxy assignment)
- Proxy chains — Multi-hop configurations and failover setups
- DNS settings — Name resolution preferences from the Proxifier profile
- Leak-protection options — UDP blocking and related privacy settings
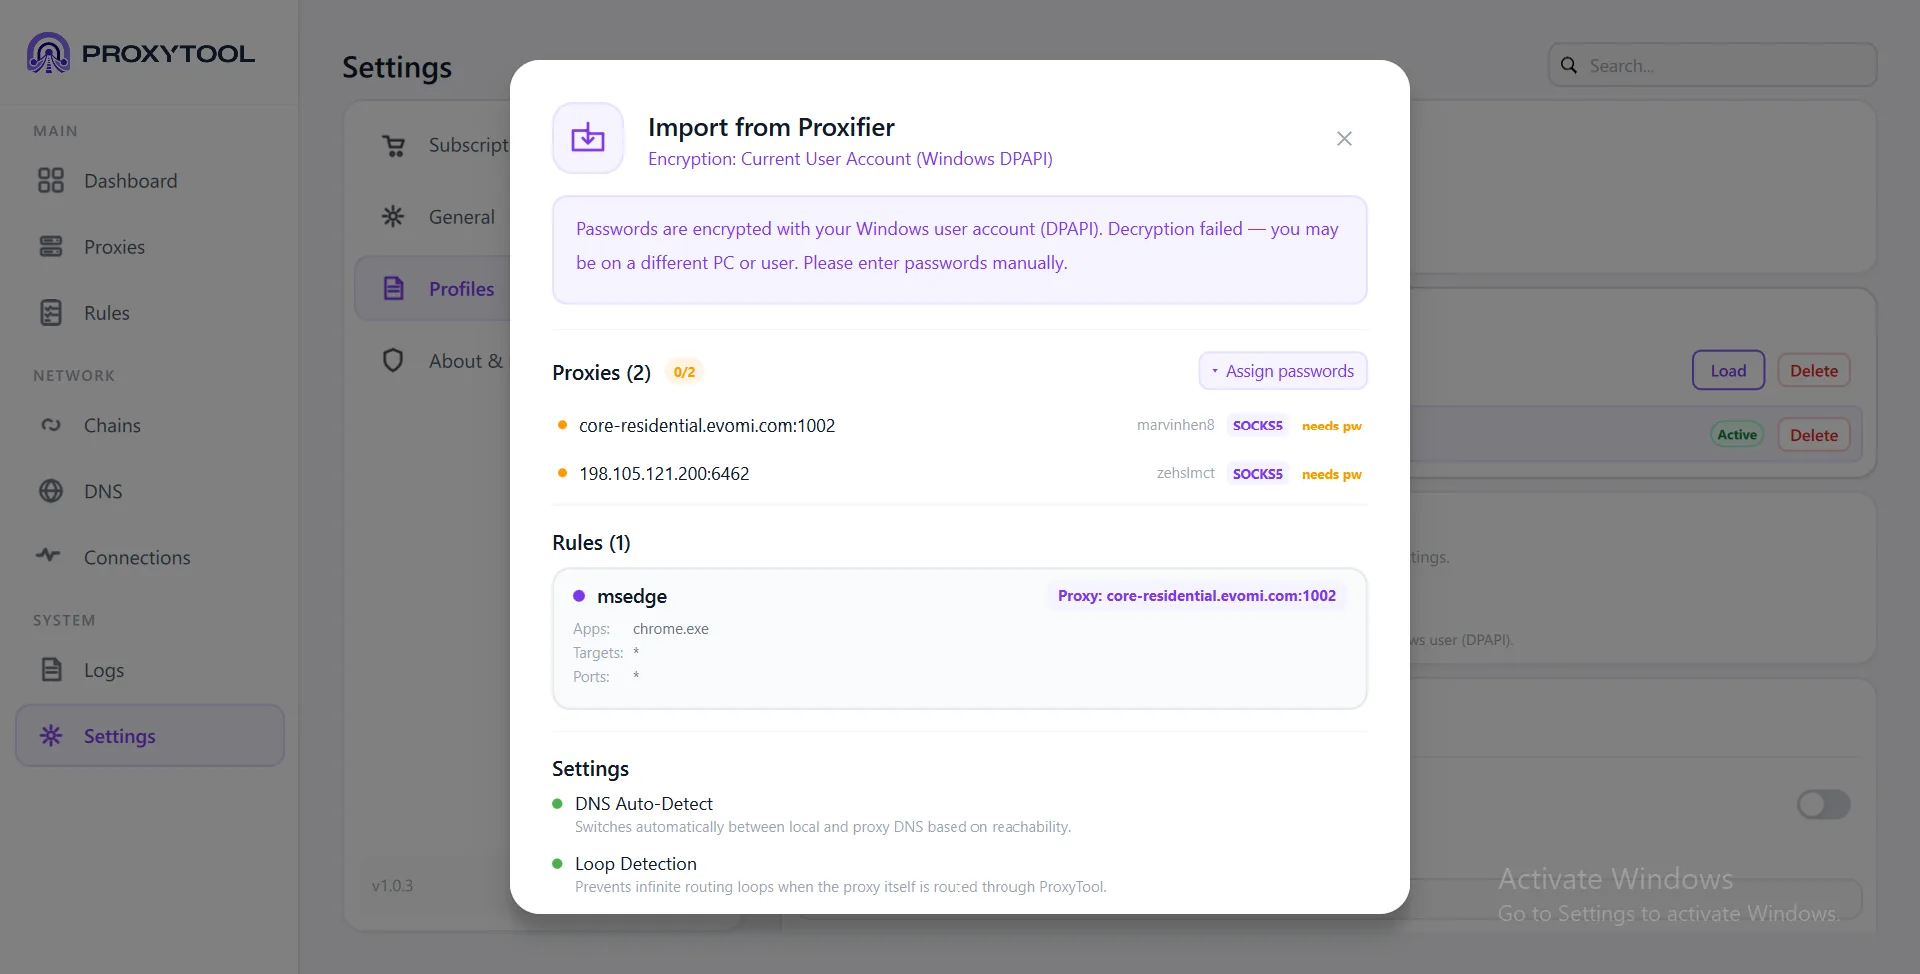
Encryption Handling
Proxifier profiles may store proxy passwords using different encryption methods. ProxyTool detects the encryption mode and handles decryption automatically when possible:
| Encryption Mode | Auto-Decrypt | Details |
|---|---|---|
| Basic (Static Key) | Not yet | Proxifier uses a built-in static key. Auto-decryption support is planned; use Password Manager for now |
| Current User Account (DPAPI) | Yes* | Automatically decrypted if importing on the same Windows user account that created the Proxifier profile. Fails on a different PC or user — use Password Manager |
| Master Password | Not yet | Requires the original master password. Auto-decryption support is planned; use Password Manager for now |
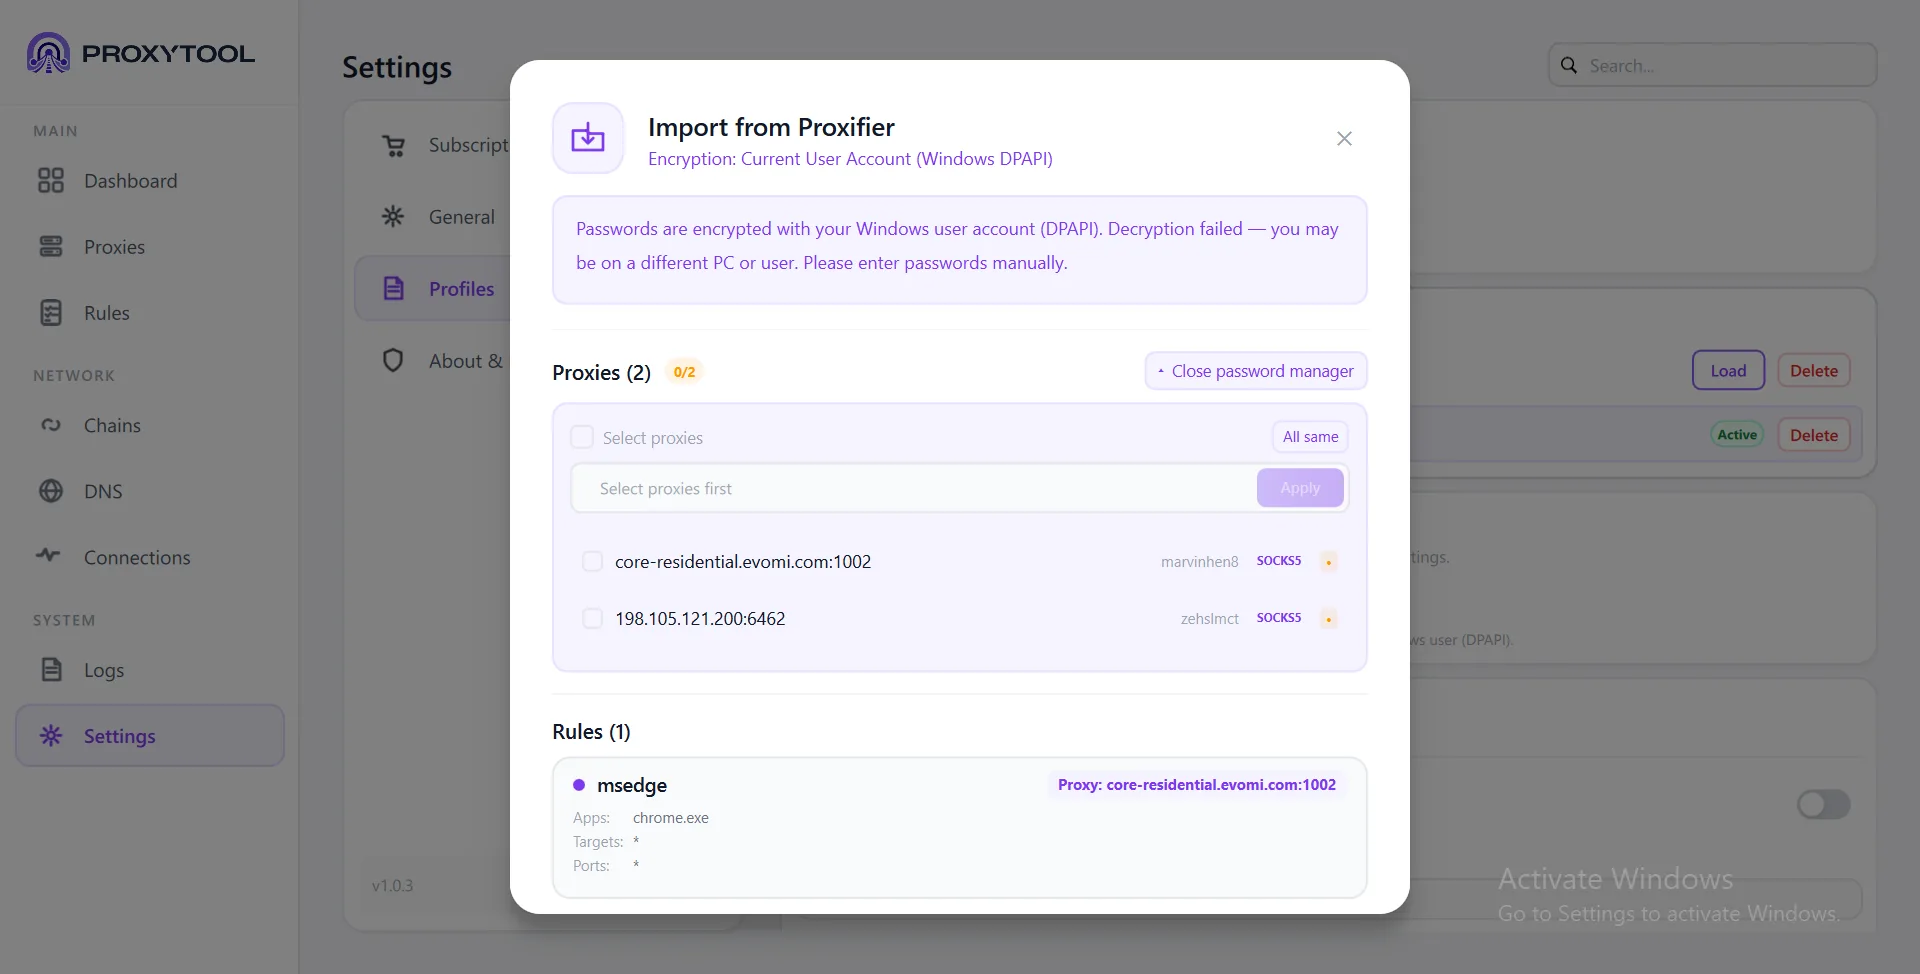
Password Manager Workflow
The Password Manager appears inside the import modal when automatic decryption is not available. It provides a bulk interface for entering proxy passwords:
- Proxy selection — Select individual proxies via checkboxes, or use the header checkbox to select all
- "All same" bulk-apply — Enter one password and apply it to all selected proxies at once
- Per-proxy fields — Individual password input fields for each proxy that needs credentials
- Apply button — Commits the entered passwords to the import configuration
- Progress badge — Shows completion status (e.g. "0/3") indicating how many proxies still need passwords
After Import
Imported items are added to the current active configuration. Proxies, chains, rules, and settings merge into the workspace immediately. To persist the imported configuration as a named profile, use Save As in the Profiles tab.
Web Dashboard Overview
The web dashboard at /dashboard is where administrators manage organizations, deploy proxy configurations to managed devices, and control what end users can do in the desktop client. It is separate from the desktop app's own Dashboard page — this section documents the web admin portal.
Sidebar Navigation
| Section | Pages | Availability |
|---|---|---|
| Overview | Dashboard, Proxies, Download Client, Network Overview | Network Overview requires Fleet access |
| Management | Fleet, Users, Groups, Policies, Restrictions, Permissions & Roles | Plan-dependent (see below) |
| Account | Billing, Referral, Settings | Always |
| Support | Help & Support | Always |
Plan Features
| Feature | Standard / Trial | Team Premium |
|---|---|---|
| Fleet | Yes | Yes |
| Groups | Yes | Yes |
| Policies | Yes | Yes |
| Automations | Yes | Yes |
| Users & Roles | No | Yes |
| Device Restrictions | No | Yes |
| Permissions & Roles | No | Yes |
| Entitlements / Credit Pool | No | Yes |
Deployment Flow
Managed configurations reach devices through groups — not by assigning directly to individual devices:
- Create a Policy — define proxies, chains, rules, DNS, and app settings in the Policy Editor
- Create a Restriction (Team Premium) — optionally limit what users can change in the desktop client
- Create a Device Group — add the target devices as members
- Assign Policy & Restriction to the group — from the Policy or Restriction editor (Summary / Assignments tab)
- Push — configurations are delivered to all devices in the group via MQTT
- Verify in Fleet — check device status, applied policy version, and active configuration
- Policy = what configuration devices use (proxies, rules, chains, DNS, app settings)
- Restriction = what users are allowed to see and change in the desktop client
Device Groups
Device groups organize managed devices for bulk policy and restriction deployment. Navigate to Management → Groups in the web dashboard.
Creating a Group
Managing Members
- + Add Devices — select one or more fleet devices from a multi-select panel and add them to the group
- Remove — remove individual devices from the expanded group view
- Device count and member previews are shown in the collapsed group row
Assigned Policy & Restriction
When a group has an assigned policy or restriction, they are shown in the group detail panel. To change assignments, use the Policy Editor (Summary tab) or Restriction Editor (Assignments tab).
Policy Profiles
Policy profiles are managed configurations (proxies, chains, rules, DNS, app settings) that can be pushed to device groups. Navigate to Management → Policies.
Policy List
Apply Mode
Group Assignment
From the expanded policy row or the Policy Editor Summary tab:
- Select a group from the dropdown and click Assign to Group
- If the group already has a different policy, a confirmation dialog asks whether to override
- Assigned groups show device counts and online status; outdated devices (running an older policy version) are highlighted
- Unassign removes the policy from a group without deleting the policy itself
Policy Editor
The Policy Editor has six tabs. Use Import .ppx to load an existing Proxifier or ProxyTool profile, or build from scratch. Save with Save or deploy immediately with Save & Push.
Tab: Proxies
Define proxy servers included in this policy. Toolbar: + Add Proxy, Expand All, Collapse All.
| Field | Description |
|---|---|
| Proxy Name | Display label used in rules and chains |
| Host Address / Port | Proxy server connection details |
| Proxy Type | HTTP, HTTPS, SOCKS4, or SOCKS5 |
| Requires Authentication | Enable username/password auth (HTTP/HTTPS/SOCKS5) |
| Method | Basic, NTLM, or Negotiate (Kerberos) — HTTP/HTTPS only |
| Use Windows Login (SSPI) | Use current Windows credentials for NTLM/Negotiate |
| Username / Password | Inline credentials when not using SSPI |
| Send User-Agent in CONNECT | Include a custom User-Agent header in HTTP CONNECT |
| User-Agent | Custom User-Agent string value |
| User Identification (SOCKS4) | SOCKS4 user ID field |
| SOCKS4a Extension | Let proxy resolve hostnames remotely (SOCKS4a) |
| Cost per GB ($) | Rate used for cost tracking in the desktop monitor |
| Ask credentials if empty | Prompt user when credentials are missing |
| Ask if auth fails | Re-prompt on authentication failure |
| Use Target Hostname | Send hostname instead of IP to proxy |
| Authentication URL | Web-based auth URL for enterprise proxies (Blue Coat, etc.) |
Tab: Chains
| Setting | Description |
|---|---|
| Chain Name | Label referenced by routing rules |
| Simple (Sequential) | Traffic passes through all proxies in order (multi-hop). HTTP/HTTPS must be the last hop. |
| Redundancy (Failover) | Try proxies in order; switch on failure. Options: Timeout (sec), Recheck (sec), Direct if all fail. |
| Load Balancing | Random proxy per connection. Option: Same proxy per PID (session stickiness). |
| Hop Sequence / Failover Order / Pool Members | Ordered list of proxies in the chain — add via proxy buttons |
Tab: Rules
Rules are evaluated top to bottom — rule #1 has highest priority. Built-in rules: localhost (Direct) and Default (Direct).
| Field | Description |
|---|---|
| Rule name | Descriptive label |
| Enable toggle | Activate or deactivate without deleting |
| App (process name) | Semicolon-separated process names, e.g. firefox.exe; chrome.exe |
| Hosts (targets) | Target hostnames or IP patterns |
| Ports (targets) | Target port numbers or ranges |
| Protocol | TCP + UDP, TCP only, or UDP only (UDP requires SOCKS5) |
| Action: Direct | Bypass proxy — connect directly |
| Action: Proxy | Route via a specific proxy. Options: Via Proxy, IPv6 through proxy, Interface (Auto/Specific) |
| Action: Chain | Route via a proxy chain. Options: Via Chain, IPv6 through proxy, Interface |
| Action: Block | Drop matching connections |
Tab: DNS & Security
%ComputerName%, *.local, etc.Tab: App Settings
Each setting has a Manage checkbox (include in policy) and a value toggle. Unmanaged settings remain under user control on the device.
| Category | Settings |
|---|---|
| System | Icon in System Tray, Minimize to System Tray |
| Notifications | Desktop Notifications |
| Monitoring | Show Traffic on Tray Icon, Show Direct Logs & Connections |
| Safety | Infinite Connection Loop Detection, Infinite Name Resolution Loop Detection |
| Diagnostics | Debug Mode (logs to %LOCALAPPDATA%/ProxyTool/Logs/) |
| Profile & Updates | Update Profile on Start, Keep Credentials on Update, Password Encryption (Disabled / Basic / DPAPI / Master Password) |
Tab: Summary
Shows policy statistics (proxy, chain, rule counts) and the Group Assignments section — assign or unassign groups directly from the editor before pushing.
Device Restrictions
Device restrictions control what end users can see and do in the desktop client. Available on Team Premium plans. Navigate to Management → Restrictions.
Restriction List
- + New Restriction Profile — create with name and description
- Each profile shows active restriction count and assigned group count
- Edit opens the Restriction Editor
- Delete removes the profile (also unassigns from groups)
Templates
Save & Push
Save stores the restriction profile. Save & Push saves and immediately applies restrictions to all devices in assigned groups via MQTT.
Hide (UI Visibility) — removes a page or section from the desktop UI entirely.
Allow (Permissions) — when OFF, the user cannot perform that action (e.g. add a proxy).
Lock (Permissions) — when ON, the user cannot change that setting even if they can see it.
Restriction Editor
Three tabs: UI Visibility, Permissions & Locks, and Assignments.
Tab: UI Visibility
Control which pages and UI elements are hidden in the desktop client sidebar and settings.
Navigation (Sidebar Pages)
| Toggle | Effect when enabled (hidden) |
|---|---|
| Hide Dashboard | Dashboard/Home page removed from sidebar |
| Hide Proxies | Proxies page removed |
| Hide Rules | Rules page removed |
| Hide AI Assistant | AI Assistant page removed |
| Hide Chains | Chains page removed |
| Hide DNS | DNS page removed |
| Hide Connections | Entire Connections page removed |
| Hide Analytics Tab | Analytics sub-tab hidden (requires Connections visible) |
| Hide Connections Tab | Connections sub-tab hidden (requires Connections visible) |
| Hide Logs | Logs page removed |
| Hide Settings | Settings page removed from navigation |
General UI
Settings Page Sections
Tab: Permissions & Locks
Proxies
| Toggle | Type | When restricted |
|---|---|---|
| Allow Add Proxy | Allow | User cannot add new proxy servers |
| Allow Edit Proxy | Allow | User cannot modify existing proxy settings |
| Allow Delete Proxy | Allow | User cannot remove proxy servers |
| Lock Proxy Authentication Credentials | Lock | Username/password fields are read-only |
Rules
| Toggle | Type | When restricted |
|---|---|---|
| Allow Add Rule | Allow | User cannot create new routing rules |
| Allow Edit Rule | Allow | User cannot modify existing rules |
| Allow Delete Rule | Allow | User cannot remove rules |
| Allow Activate Rule | Allow | User cannot enable disabled rules |
| Allow Deactivate Rule | Allow | User cannot disable active rules |
Chains
| Toggle | Type | When restricted |
|---|---|---|
| Allow Add Chain | Allow | User cannot create new proxy chains |
| Allow Edit Chain | Allow | User cannot modify existing chains |
| Allow Delete Chain | Allow | User cannot remove chains |
AI Assistant
DNS & Network Protection
Profiles
| Toggle | Type | When restricted |
|---|---|---|
| Allow Load Profiles | Allow | User cannot open/load existing profiles |
| Allow Save Profiles | Allow | User cannot save profile changes |
| Allow Create Profiles | Allow | User cannot create new profiles |
| Allow Delete Profiles | Allow | User cannot delete profiles |
| Allow Rename Profiles | Allow | User cannot rename profiles |
| Allow Export Profiles | Allow | User cannot export .ppx files |
| Allow Import Profiles | Allow | User cannot import .ppx files |
| Allow Profile Change | Allow | User cannot switch active profile |
| Lock Password Encryption | Lock | User cannot change encryption mode or remove encryption |
Settings & System
| Toggle | Type | When locked |
|---|---|---|
| Lock Auto-Update | Lock | User cannot disable automatic profile updates |
| Lock System Tray Icon | Lock | User cannot hide/show the tray icon |
| Lock Minimize to Tray | Lock | User cannot change minimize-to-tray behavior |
| Lock Show Traffic on Tray | Lock | User cannot toggle live traffic on tray icon |
Monitoring & Diagnostics
| Toggle | Type | When locked |
|---|---|---|
| Lock Show Direct Logs | Lock | User cannot toggle direct-routed traffic in logs |
| Lock Loop Detection | Lock | User cannot disable infinite connection loop detection |
| Lock Name Resolution Loop | Lock | User cannot disable DNS-over-proxy loop detection |
| Lock UDP Logging | Lock | User cannot enable UDP datagram logging (high volume) |
| Lock Traffic Dump | Lock | User cannot enable TCP traffic dumping (disk space risk) |
Tab: Assignments
- Assigned Groups — lists groups receiving this restriction; click Remove to unassign
- Select a group to assign… dropdown + Assign Group button
- One restriction per group — override confirmation if group already has a different restriction
- All devices in assigned groups receive the restriction automatically on push
Fleet Management
Monitor all enrolled managed devices. Navigate to Management → Fleet.
Fleet Dashboard
Device Table Columns
| Column | Description |
|---|---|
| Device | Device name and identifier |
| Platform | Operating system |
| Status | ONLINE, OFFLINE, PENDING_ENROLLMENT, or ERROR |
| Groups | Assigned device groups |
| Policy | Currently applied policy name and version |
| Restrictions | Applied restriction profile |
| Last Seen | Last heartbeat timestamp |
Device Detail Page
Click a device row to open its detail view:
- Device Information — platform, OS version, app version, enrollment date, last heartbeat
- Applied Policy — server policy version vs device-reported version; "Update pending" when outdated
- Current Configuration — active profile, proxy list, chains from device heartbeat
- Groups & Tags — group membership and custom tags
- Command History — remote commands with status (PENDING, DELIVERED, EXECUTING, COMPLETED, FAILED, EXPIRED)
Users & Roles
Manage organization members and invitations. Available on Team Premium. Navigate to Management → Users.
Tabs
Member Actions
- Change role — assign a different built-in or custom role
- Reset password — force password reset for the member
- Ban / Unban — suspend or restore account access
- Remove from organization — revoke membership
Built-in Roles
Owner, Admin, Operator, Viewer, Device Manager, Policy Manager, Help Desk — plus custom roles created in Permissions & Roles.
Permissions & Roles
Fine-grained access control for dashboard users. Navigate to Management → Permissions & Roles (Team Premium).
Tabs
Permission Categories
| Category | Examples |
|---|---|
| Proxies | View, create, edit marketplace proxies |
| Chains | Manage proxy chains |
| Devices | View fleet, wipe devices, remote commands |
| Groups | Create, edit, delete device groups |
| Policies | Create, edit, deploy (policy:deploy) |
| Config Overrides | Temporary JSON config overrides |
| Users & Roles | Invite, ban, assign roles |
| Licenses | Manage license allocations |
| AI Credits | Manage organization credit pool |
| Device Restrictions | Create, edit, assign restrictions |
| Organization | Org settings, billing visibility |
| Automations | Automation rule management |
Custom Roles
Click Create Custom Role, set name, description, scope (root or sub-org), and pick permissions from the catalog. Custom roles can be assigned to members alongside built-in roles.
Account, Billing & More
Billing
Navigate to Account → Billing.
- View current plan (Standard or Team Premium), cost, device count, renewal date
- Upgrade or downgrade between plans; adjust device seat quantity
- Switch billing interval (monthly / annual)
- Manage in Stripe Portal — update payment method, view invoices
- Cancel subscription or reactivate a cancelled plan
- Team root admins: delegate license and AI credit pools to sub-organizations
Devices (License Slots)
Navigate to Devices in the sidebar (personal license management, not Fleet).
- Shows how many of your subscription's device slots are in use
- Lists active and revoked desktop installations tied to your account
- Remove Device frees a license slot for another installation
- When all slots are used, an upgrade banner links to Billing
Proxies Marketplace
Navigate to Overview → Proxies.
- Marketplace tab — purchase residential proxy bandwidth from Evomi (PAYG or Membership subscription)
- My Products tab — manage accounts, view usage statistics, use the Proxy Generator
- Proxy Generator: configure protocol, countries, session type, output format, and expert multipliers (ISP targeting, TCP fingerprint, etc.)
Account Settings
Navigate to Account → Settings.
- Profile — view name and email (read-only)
- Password — change account password
- Two-Factor Authentication — enable TOTP (QR code + backup codes) or email OTP fallback
- Sign Out — log out of the web dashboard
- Delete Account — permanently delete account (requires password confirmation)
Referral Program
Navigate to Account → Referral to share your referral link and track commissions.
Download Client
Navigate to Overview → Download Client or visit /download to get the latest Windows installer.
Frequently Asked Questions
What's the difference between SOCKS4, SOCKS4a, and SOCKS5?
SOCKS4 supports TCP only and requires the client to resolve DNS locally (your ISP sees the domain lookup). SOCKS4a is an extension that lets the proxy resolve DNS instead — better for privacy. SOCKS5 supports both TCP and UDP, has built-in username/password authentication, and always resolves DNS remotely by default. For most use cases, SOCKS5 is recommended.
Which chain type should I use?
Simple if you need multi-hop anonymity (traffic passes through all proxies). Redundancy if you need high availability and want automatic failover to a backup proxy. Load Balancing if you want to distribute connections across multiple proxies (useful for scraping or rate-limit avoidance). Enable "Same proxy per PID" in Load Balancing if an application needs a stable IP across its session.
When will I see a TLS fingerprint warning?
Warnings appear when an application produces a TLS fingerprint (JA3 hash) that matches known automation tools or bot-like clients. For example: Python's requests library, plain curl, Go's net/http, or Selenium/Puppeteer produce recognizable fingerprints that anti-bot services can detect. Real browsers (Chrome, Firefox, Edge) produce normal fingerprints and don't trigger warnings.
How do I prevent DNS leaks?
Enable "Resolve hostnames through proxy" in DNS settings. For maximum protection, also enable "IP Protection" which blocks unsafe UDP fallback, IPv6 leaks, and forces strict DNS-over-proxy. Additionally, consider disabling Windows Smart Multi-Homed Name Resolution (registry setting) and your browser's Secure DNS (DoH) feature, as these can bypass proxy DNS.
What happens if all proxies in a chain fail?
For Redundancy chains: if "Connect directly if all fail" is enabled, traffic bypasses proxies and goes direct. If disabled (default), the connection is blocked entirely. Failed proxies are automatically rechecked at the configured interval (default: every 5 minutes). For Load Balancing chains: there's no automatic recheck — use the "Reset Fail Status" button or manually re-test proxies. For Simple chains: the entire chain fails if any single hop fails.
Can I use HTTP proxies for UDP traffic (QUIC/WebRTC)?
No. HTTP and SOCKS4 proxies only support TCP. UDP traffic (including QUIC/HTTP3, WebRTC, mDNS) cannot be routed through them. If "Block unsafe UDP fallback" is enabled in DNS settings, UDP from matched applications will be dropped rather than sent direct. Use SOCKS5 if you need UDP relay support — it's the only protocol that handles UDP natively.
How is bandwidth calculated for billing?
Bandwidth = total bytes (upload + download) through proxy connections. Traffic that bypasses the proxy (via Direct rules or split tunneling) is never counted. Protocol overhead (proxy headers) is included but typically negligible (<1%). The "Cost per GB" rate set on each proxy is used for cost calculation in the Monitoring page — this is separate from your ProxyTool subscription.
What does "Use Authentication URL" do?
Some enterprise proxies (like Blue Coat/Symantec) require web-based authentication instead of inline credentials. When enabled, ProxyTool authenticates by accessing the specified URL rather than sending username/password in the proxy protocol handshake. The URL can contain embedded credentials (scheme://user:pass@host) or trigger a browser-based auth flow. This automatically disables the regular credential prompts.
Can I migrate from Proxifier?
Yes. Go to Settings → Profiles → "Migrate from Proxifier". Import your .ppx or .xml file — ProxyTool will import your proxy servers, chains, routing rules, DNS settings, and leak protection options. Passwords encrypted with DPAPI require the same Windows user account. After import, review the configuration in ProxyTool's UI before activating.
Does ProxyTool work with all applications?
Yes. ProxyTool operates at the kernel level using a WFP (Windows Filtering Platform) driver, intercepting traffic from any application — including games, desktop apps, CLI tools, and background services. Applications don't need built-in proxy settings. The only excluded processes are ProxyTool itself (to avoid loops) and system-critical Windows services (for stability).
What is the difference between a Policy and a Restriction?
A Policy defines the configuration deployed to devices — proxies, chains, rules, DNS, and app settings. A Restriction controls what end users can see and change in the desktop client (UI visibility and permission locks). Both are assigned to device groups and pushed via MQTT.
Can I assign multiple policies to one group?
No. Each device group can have exactly one policy and one restriction. Assigning a new policy to a group that already has one triggers an override confirmation. To use a different policy, assign it from the Policy Editor or Policies list — the previous assignment is replaced.
What does Additive vs Override apply mode do?
Additive merges the pushed policy with existing local configuration — settings not covered by the policy remain on the device. Override replaces the entire device configuration with the policy content. Use Override for strict managed deployments; use Additive when devices may have local additions.
What happens when I hide Proxies vs lock Add Proxy?
Hide Proxies (UI Visibility) removes the Proxies page from the sidebar entirely — the user cannot see or access it. Allow Add Proxy (Permissions) keeps the page visible but blocks creating new proxies when turned OFF. You can combine both: hide the page for a clean UI, or show it but lock editing.
Standard vs Team Premium — what management features do I get?
Standard includes Fleet, Groups, Policies, and Automations. Team Premium adds Users & Roles, Device Restrictions, Permissions & Roles, and organization-level AI credit pool management. Upgrade from Account → Billing in the web dashboard.
How does policy push reach devices?
When you click Push & Release or Save & Push, the server sends the policy (or restriction) to all online devices in assigned groups via MQTT. Devices apply the configuration and report back via heartbeat. Check Fleet for applied policy version and "Update pending" status if a device hasn't synced yet.
What is the difference between Fleet devices and License slots?
License slots (Devices page) track how many desktop installations your subscription allows — personal activations tied to your account. Fleet devices (Management → Fleet) are organization-managed endpoints enrolled for remote policy deployment, status monitoring, and restrictions. A device can be both a licensed installation and a fleet-managed device.
Where do I assign a policy to a group?
Assign from the Policy Editor → Summary tab or from the expanded policy row on the Policies list page. The Groups page shows assigned policy/restriction as read-only links — it does not perform assignments. The same applies to restrictions via the Restriction Editor → Assignments tab.